This is an example of how GTM server side can be used to create your own digital analytics tool. It is a proof of concept of what you can do given the power of GTM server side and its BigQuery integration. I customise the stream by adding cookieless tracking, displaying the data in Shiny and running it all on Cloud Run to keep costs down but performance good.
I shall dub this tool Edmonlytica.
Edmonlytica features:
- KISS metrics: hits + page views + sessions
- No cookies
- Control entire data flow
- Real-time data stream I/O using BigQuery
- R Shiny front end to plug into R package ecosystem
- AI!!! (Not really)
- Runs on infrastructure that scales with you, from 0 cost for light usage.
I think the above is all that is needed for my blog, and probably a lot of others. It wouldn’t be suitable for advanced website analytics, but the framework could be used to make tools that slot into those more sophisticated systems.
Resources
The information for this post is gathered from various sources:
- Baz Analytics in the GTM server side documentation
- Nicolas Hinternesch’s post on creating a custom GTM-SS client for AT-Internet
- My previous post on running a real-time forecasting dashboard using GTM, GCP and Shiny
- My other post about deploying GTM Server Side on Cloud Run
The template exports for the tags below are available on GitHub:
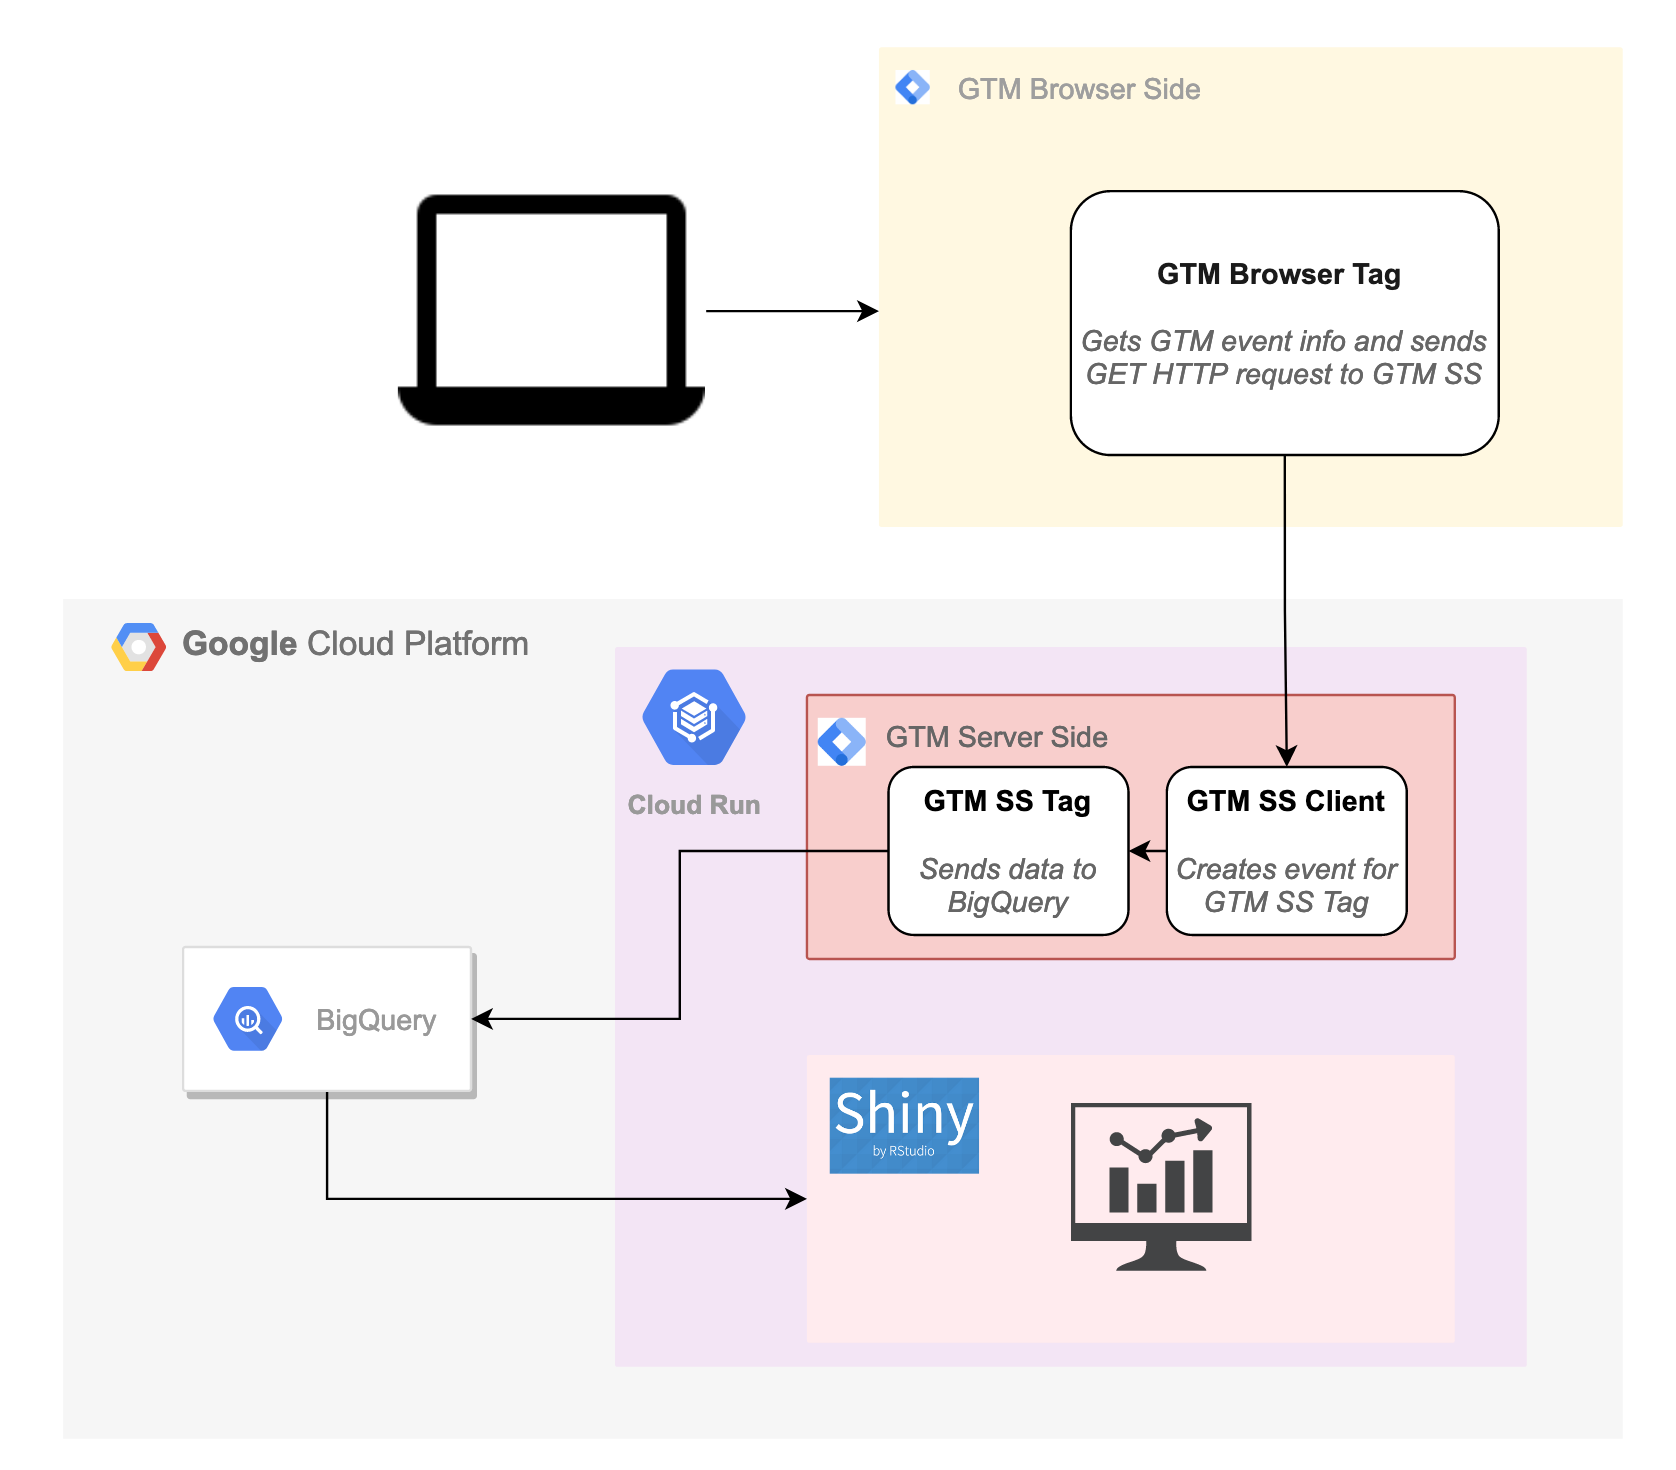
The Plan
The things to configure are:
- GTM Browser side tag - capturing the data and sending it to
/edmonlytica - GTM Server side client - receiving the payload from
/edmonlytica, adding a hashed userID and putting the data into a GTM event format - GTM Server side tag - taking the GTM event format and sending it to BigQuery
- BigQuery - real-time capture, storage, aggregation and analysis of the data streams
- Shiny - connecting to BigQuery to process the data and display information based on the data
GTM Browser Side Configuration
Deploy GTM browser side on your website, changing the tracking script to point at your GTM Server Side URL instead of www.googletagmanager.com e.g. for my GTM SS URL of https://gtm2.markedmondson.me its:
<script>(function(w,d,s,l,i){w[l]=w[l]||[];w[l].push({'gtm.start':
new Date().getTime(),event:'gtm.js'});var f=d.getElementsByTagName(s)[0],
j=d.createElement(s),dl=l!='dataLayer'?'&l='+l:'';j.async=true;j.src=
'https://gtm2.markedmondson.me/gtm.js?id='+i+dl;f.parentNode.insertBefore(j,f);
})(window,document,'script','dataLayer','GTM-WFFMBH');</script>
In the GTM Server Side setup create a “Google Tag Manager: Web Container” as specified in the GTM Server Side documentation
Making a browser side tag to send in the events.
This will send in GTM events as per traditional GTM setups.
I choose not to ride on the back of the GA events like the Baz Analytics example, so will need to send to my own endpoint.
The tag will instead send it to its own GTM server side endpoint /edmondlytica, reading the event information from the GTM trigger the tag is set up for.
It includes a timestamp and the eventId as they could be useful.
const log = require('logToConsole');
const copyFromDataLayer = require('copyFromDataLayer');
const encodeUri = require('encodeUri');
const sendPixel = require('sendPixel');
const getReferrerUrl = require('getReferrerUrl');

log('data =', data);

const gtm = copyFromDataLayer('gtm');

const the_url = data.transport_url + '/edmonlytica' +
    '?event=' + copyFromDataLayer('event') +
    '&referrer=' + getReferrerUrl() +
    '&ts=' + gtm.start +
    '&eventId=' + data.gtmEventId +
    '&custom=' + data.custom +
    '&page=' + data.pagepath;

log('the_url:', encodeUri(the_url));

sendPixel(encodeUri(the_url), data.gtmOnSuccess(), data.gtmOnFailure());
This code is set via a tag template, with a data.transport_url field to swap out which GTM server-side instance you want to use. My default is set to https://gtm2.markedmondson.me.
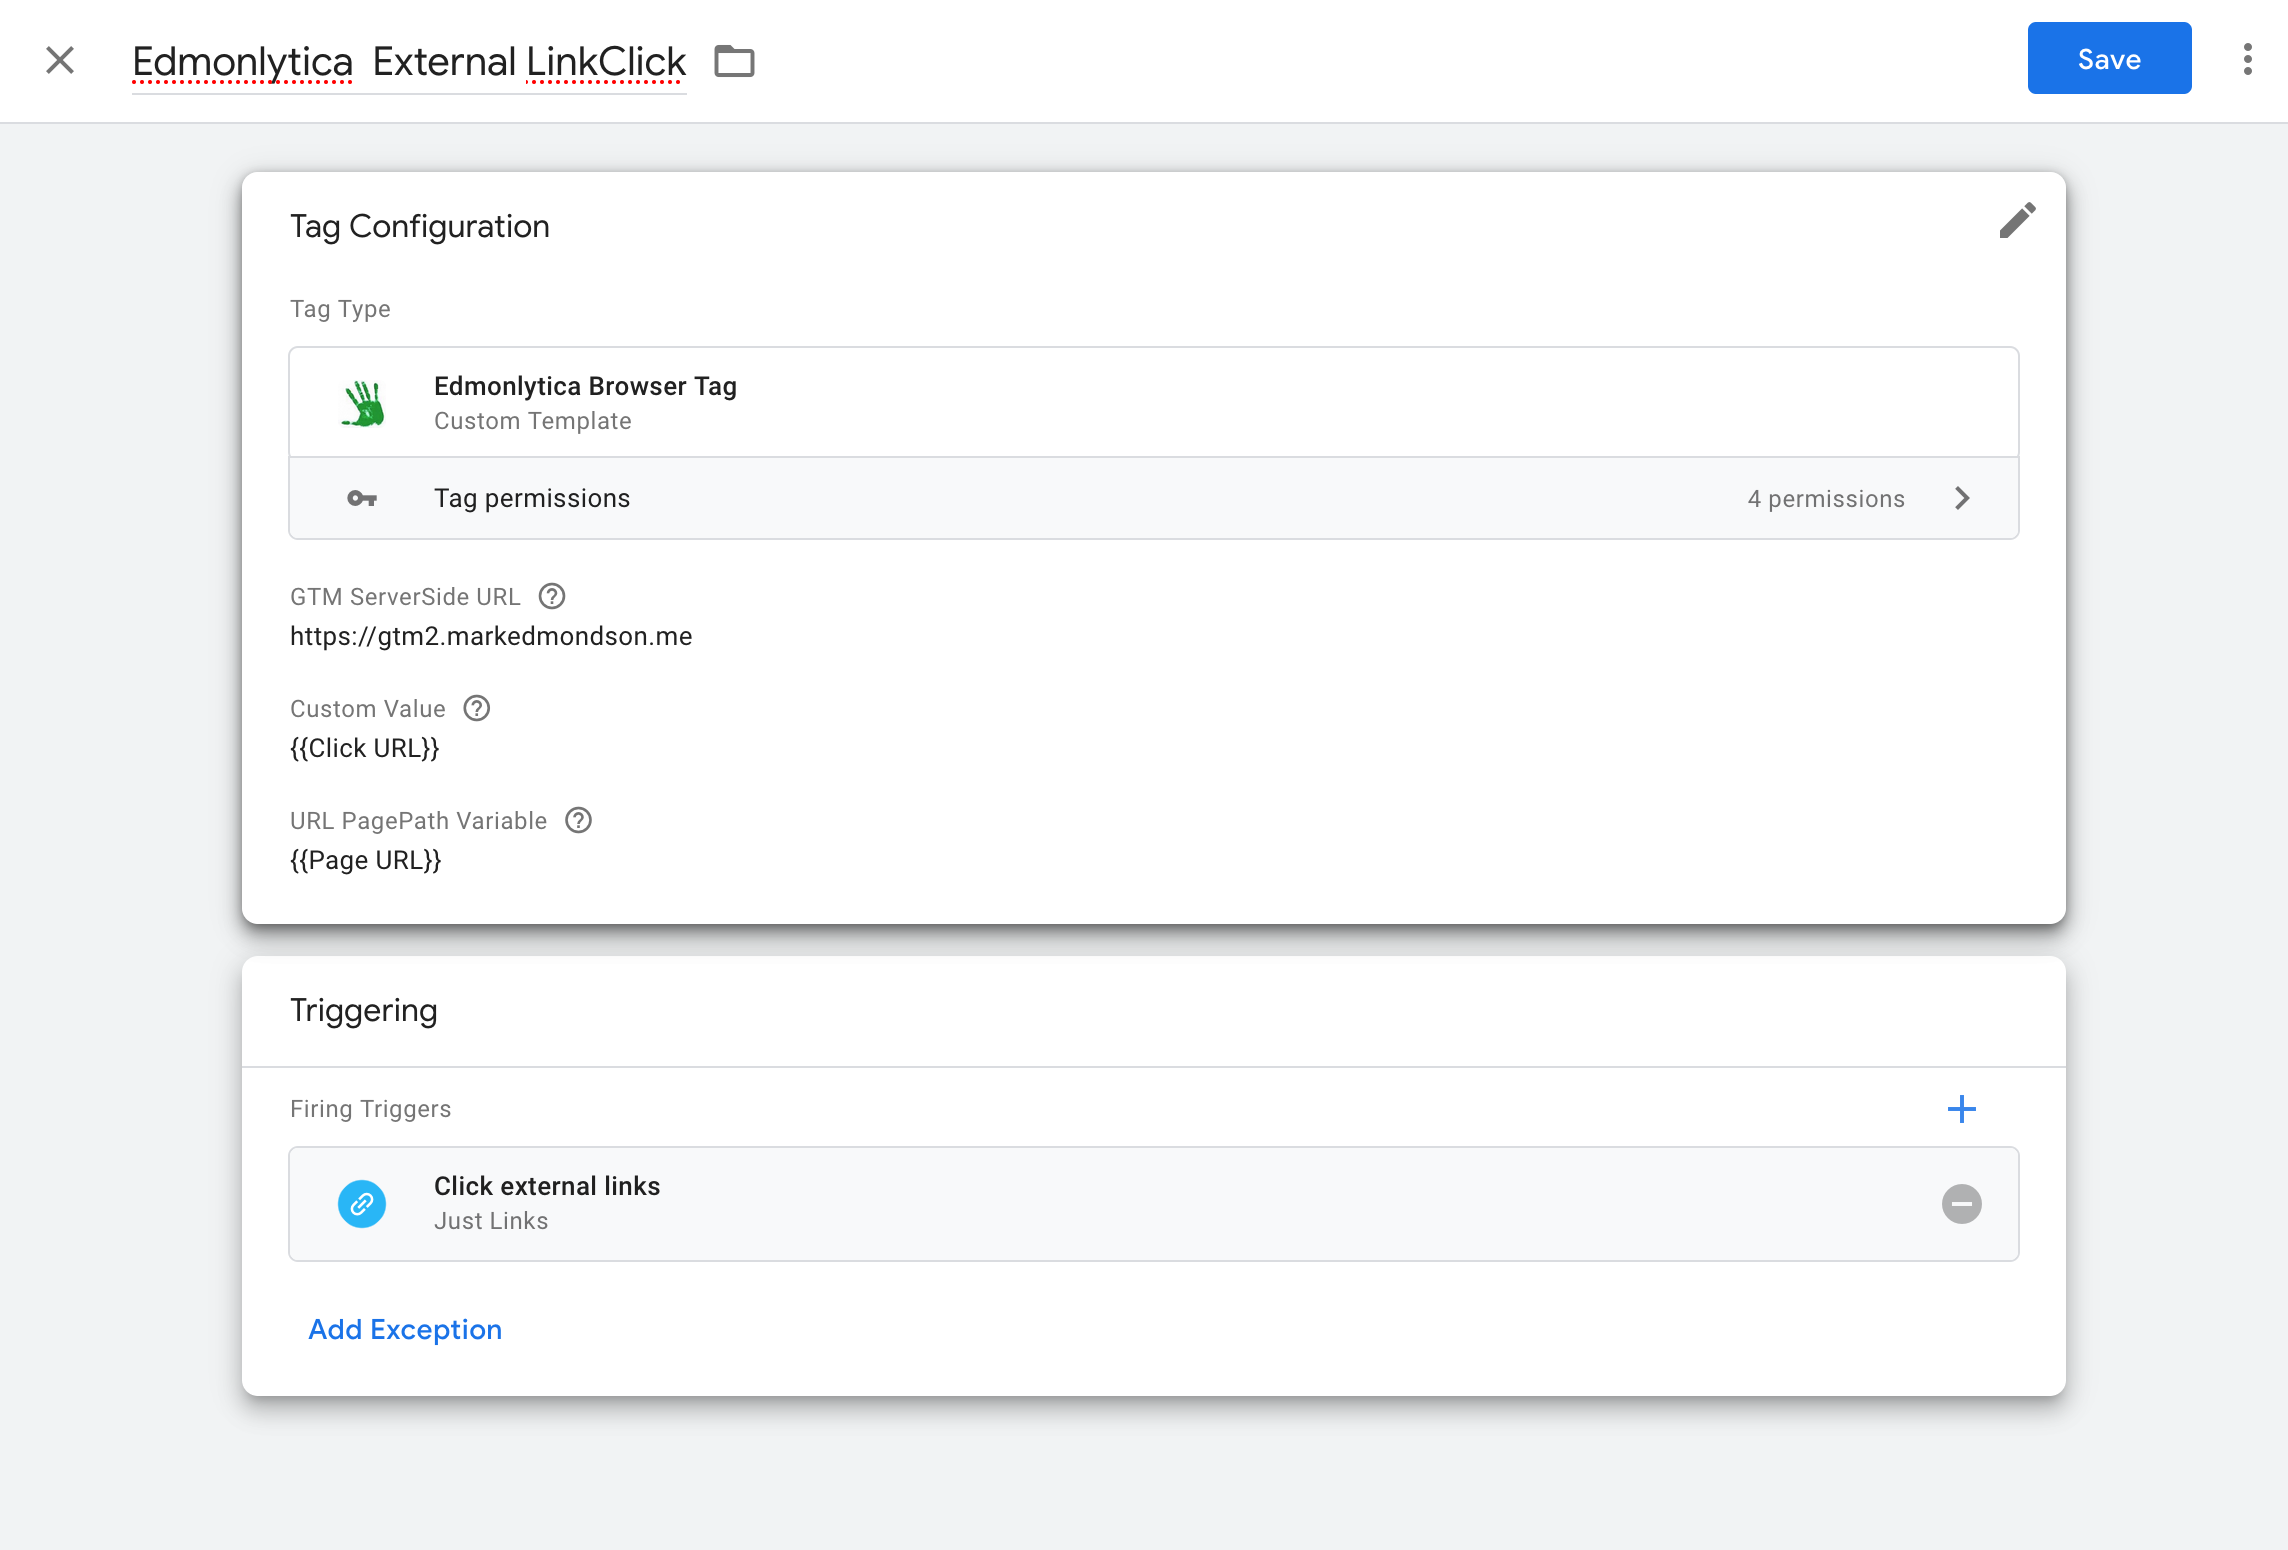
I also have a field for variables that can be set with GTM macros such as {{Click URL}} and instead of hardcoding the page that will be sent in the tag use by default the macro {{Page URL}}. This gives some flexibility on precisely what information is sent, such as stripping out parameters or not, via GTM trigger configuration.
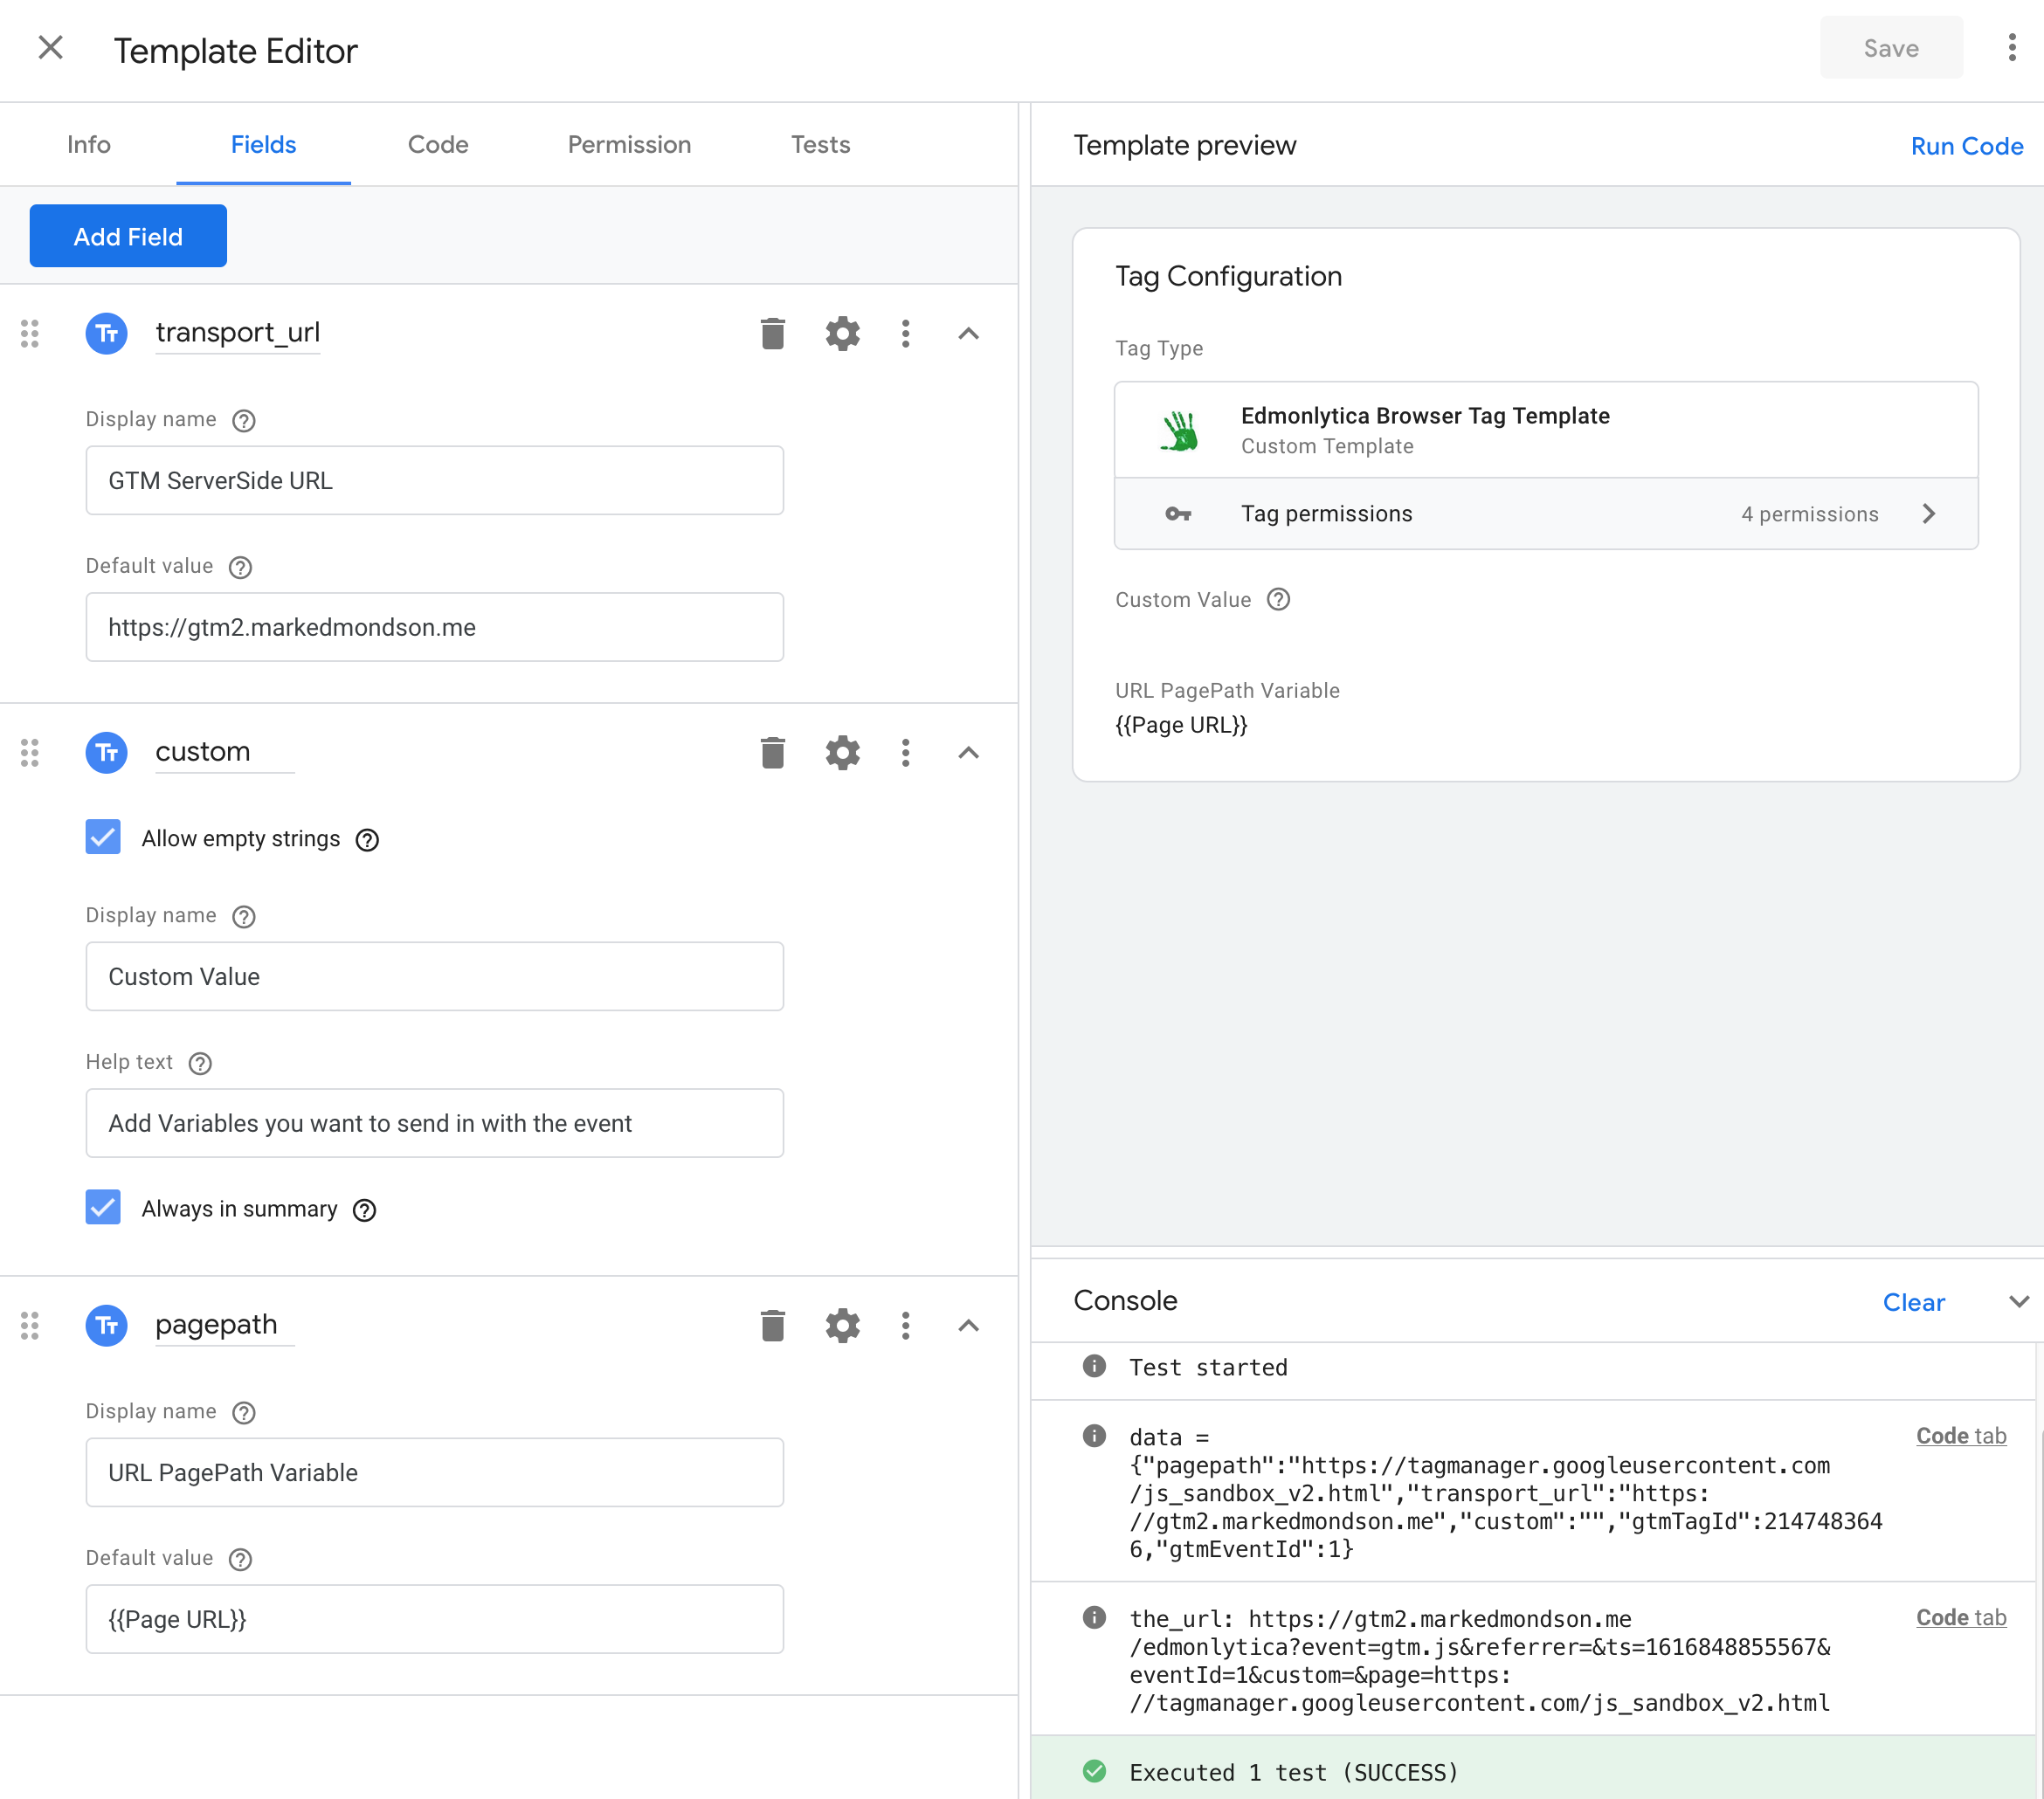
Edmonlytica GTM Browser tag template data fields
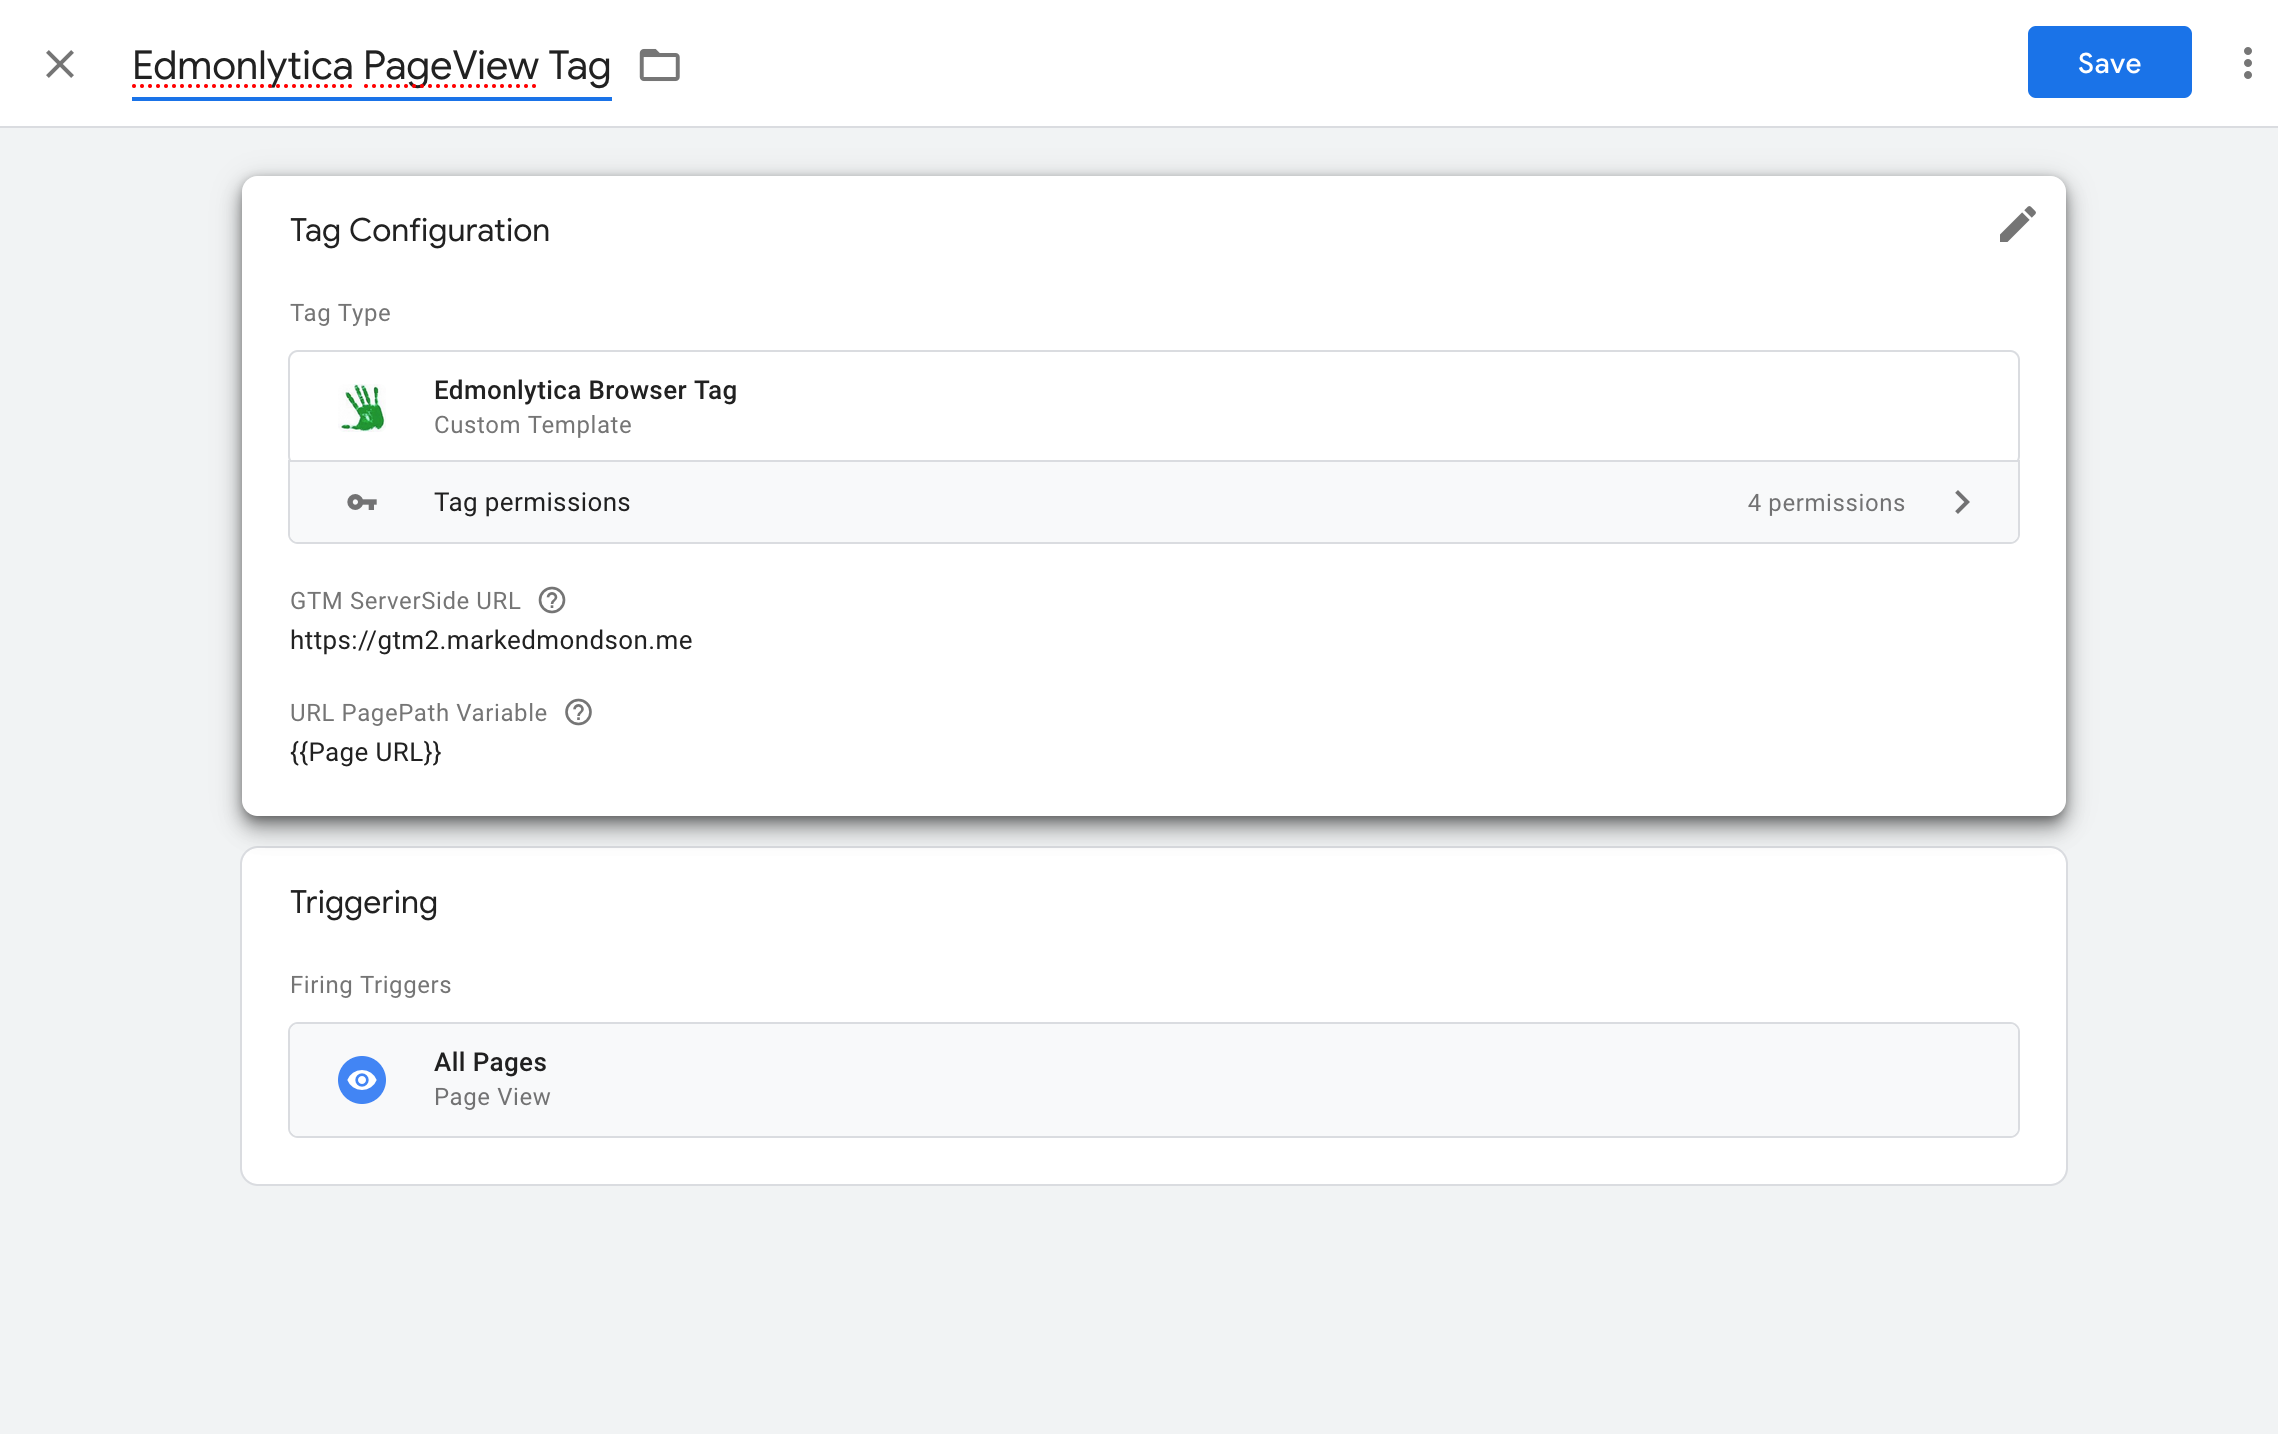
Making the tag instances + using the custom field
Edmonlytica only has one custom field, which is used to send in unique data for the trigger you are using.
By default with no custom field you are only collecting page views.
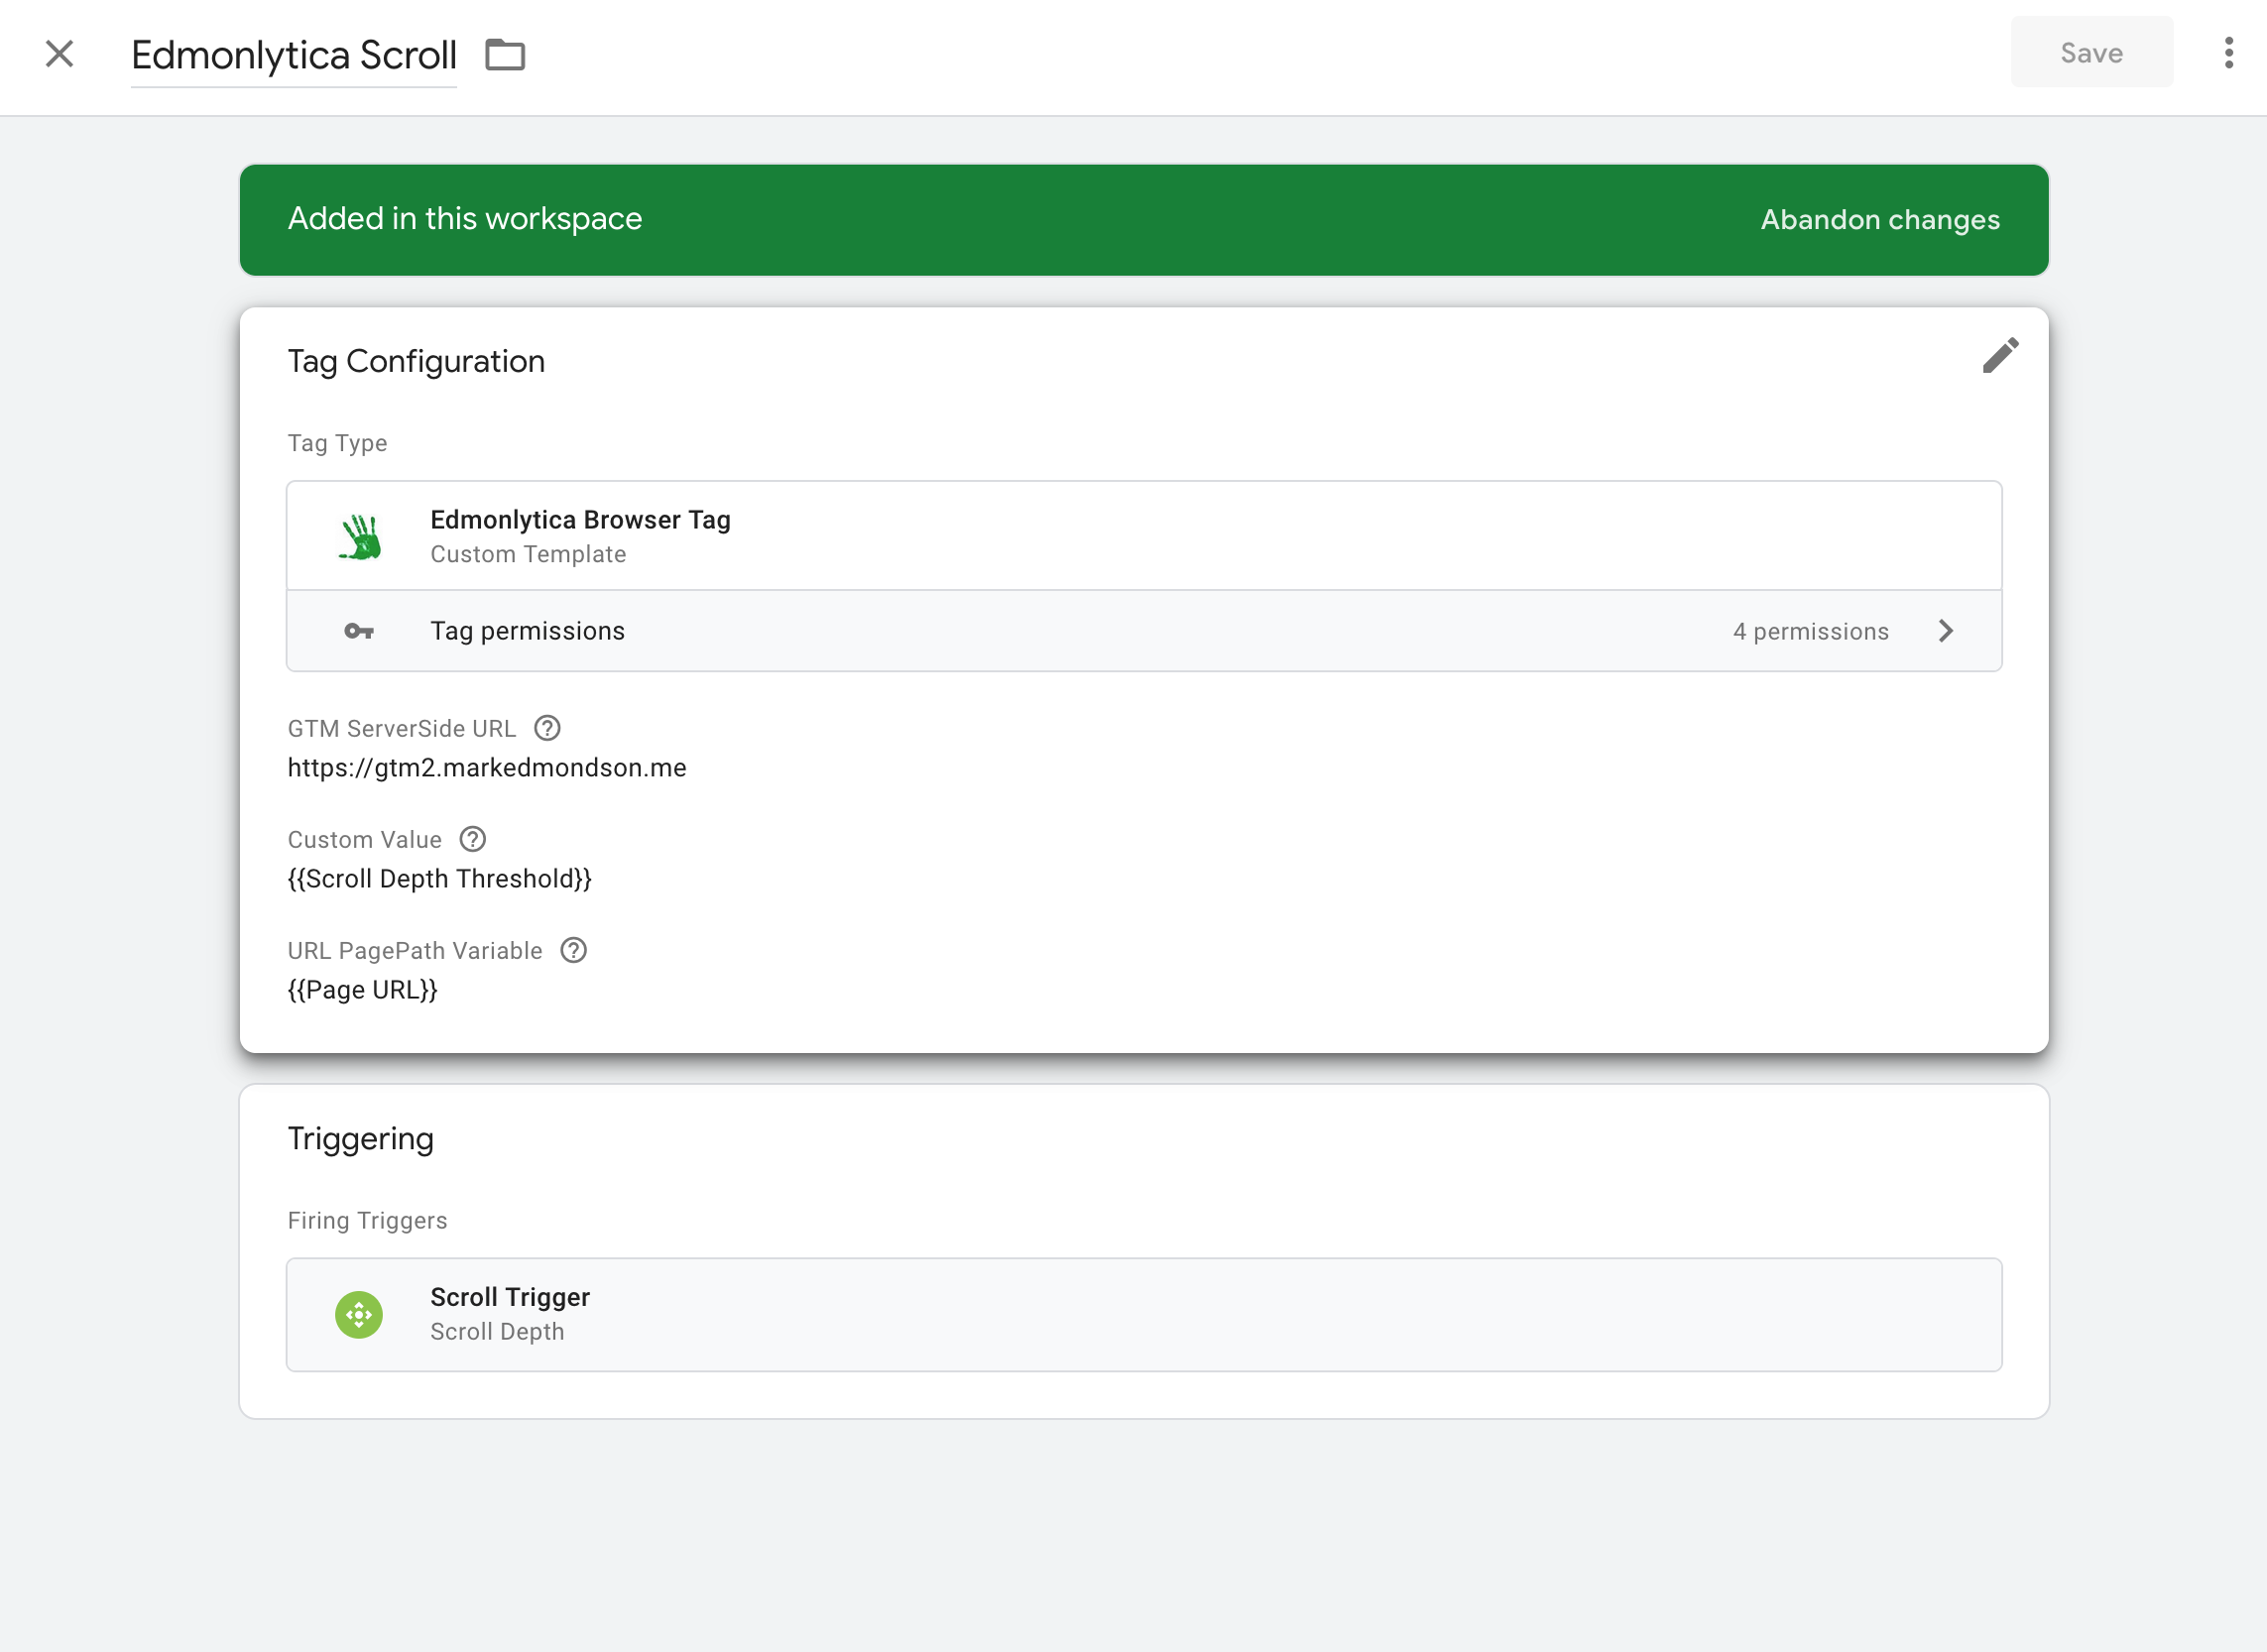
I also added two other instances - one linked to my External Link Clicks trigger (all those linkCicks that do not go to my own website), and the Scroll Depth trigger. See the other Built-in GTM variables for other ideas, or use JavaScript to make your own.
I now create instances of my tag and choose what triggers it - for me pageviews, external link triggers and scroll events for 50% and 90% of the page length, but you could add any other GTM trigger you have created. The tag will capture the event details for that trigger.
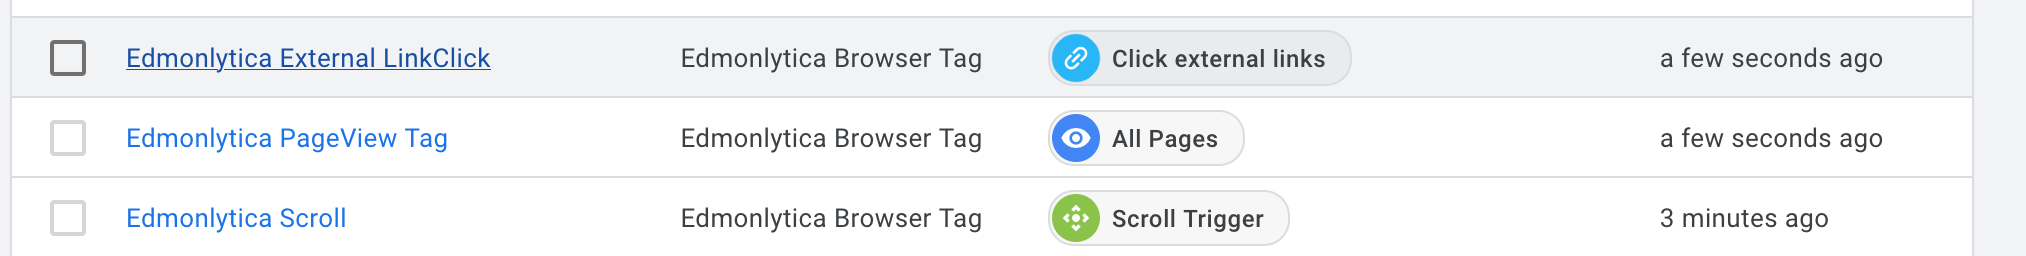
Edmonlytica GTM Browser-side tag instances
Publishing the tag or in preview mode I can see the logs showing the URL is being formed correctly, but getting a 400 error as we haven’t setup the server-side yet. In my case the triggers for a pageview = gtm.js and for an external link click = gtm.linkClick

Logs in Web Console Network tab - (click to make larger)
Now I need the GTM Server Side Client that will accept the /edmonlytica endpoint, process it and send it into BigQuery.
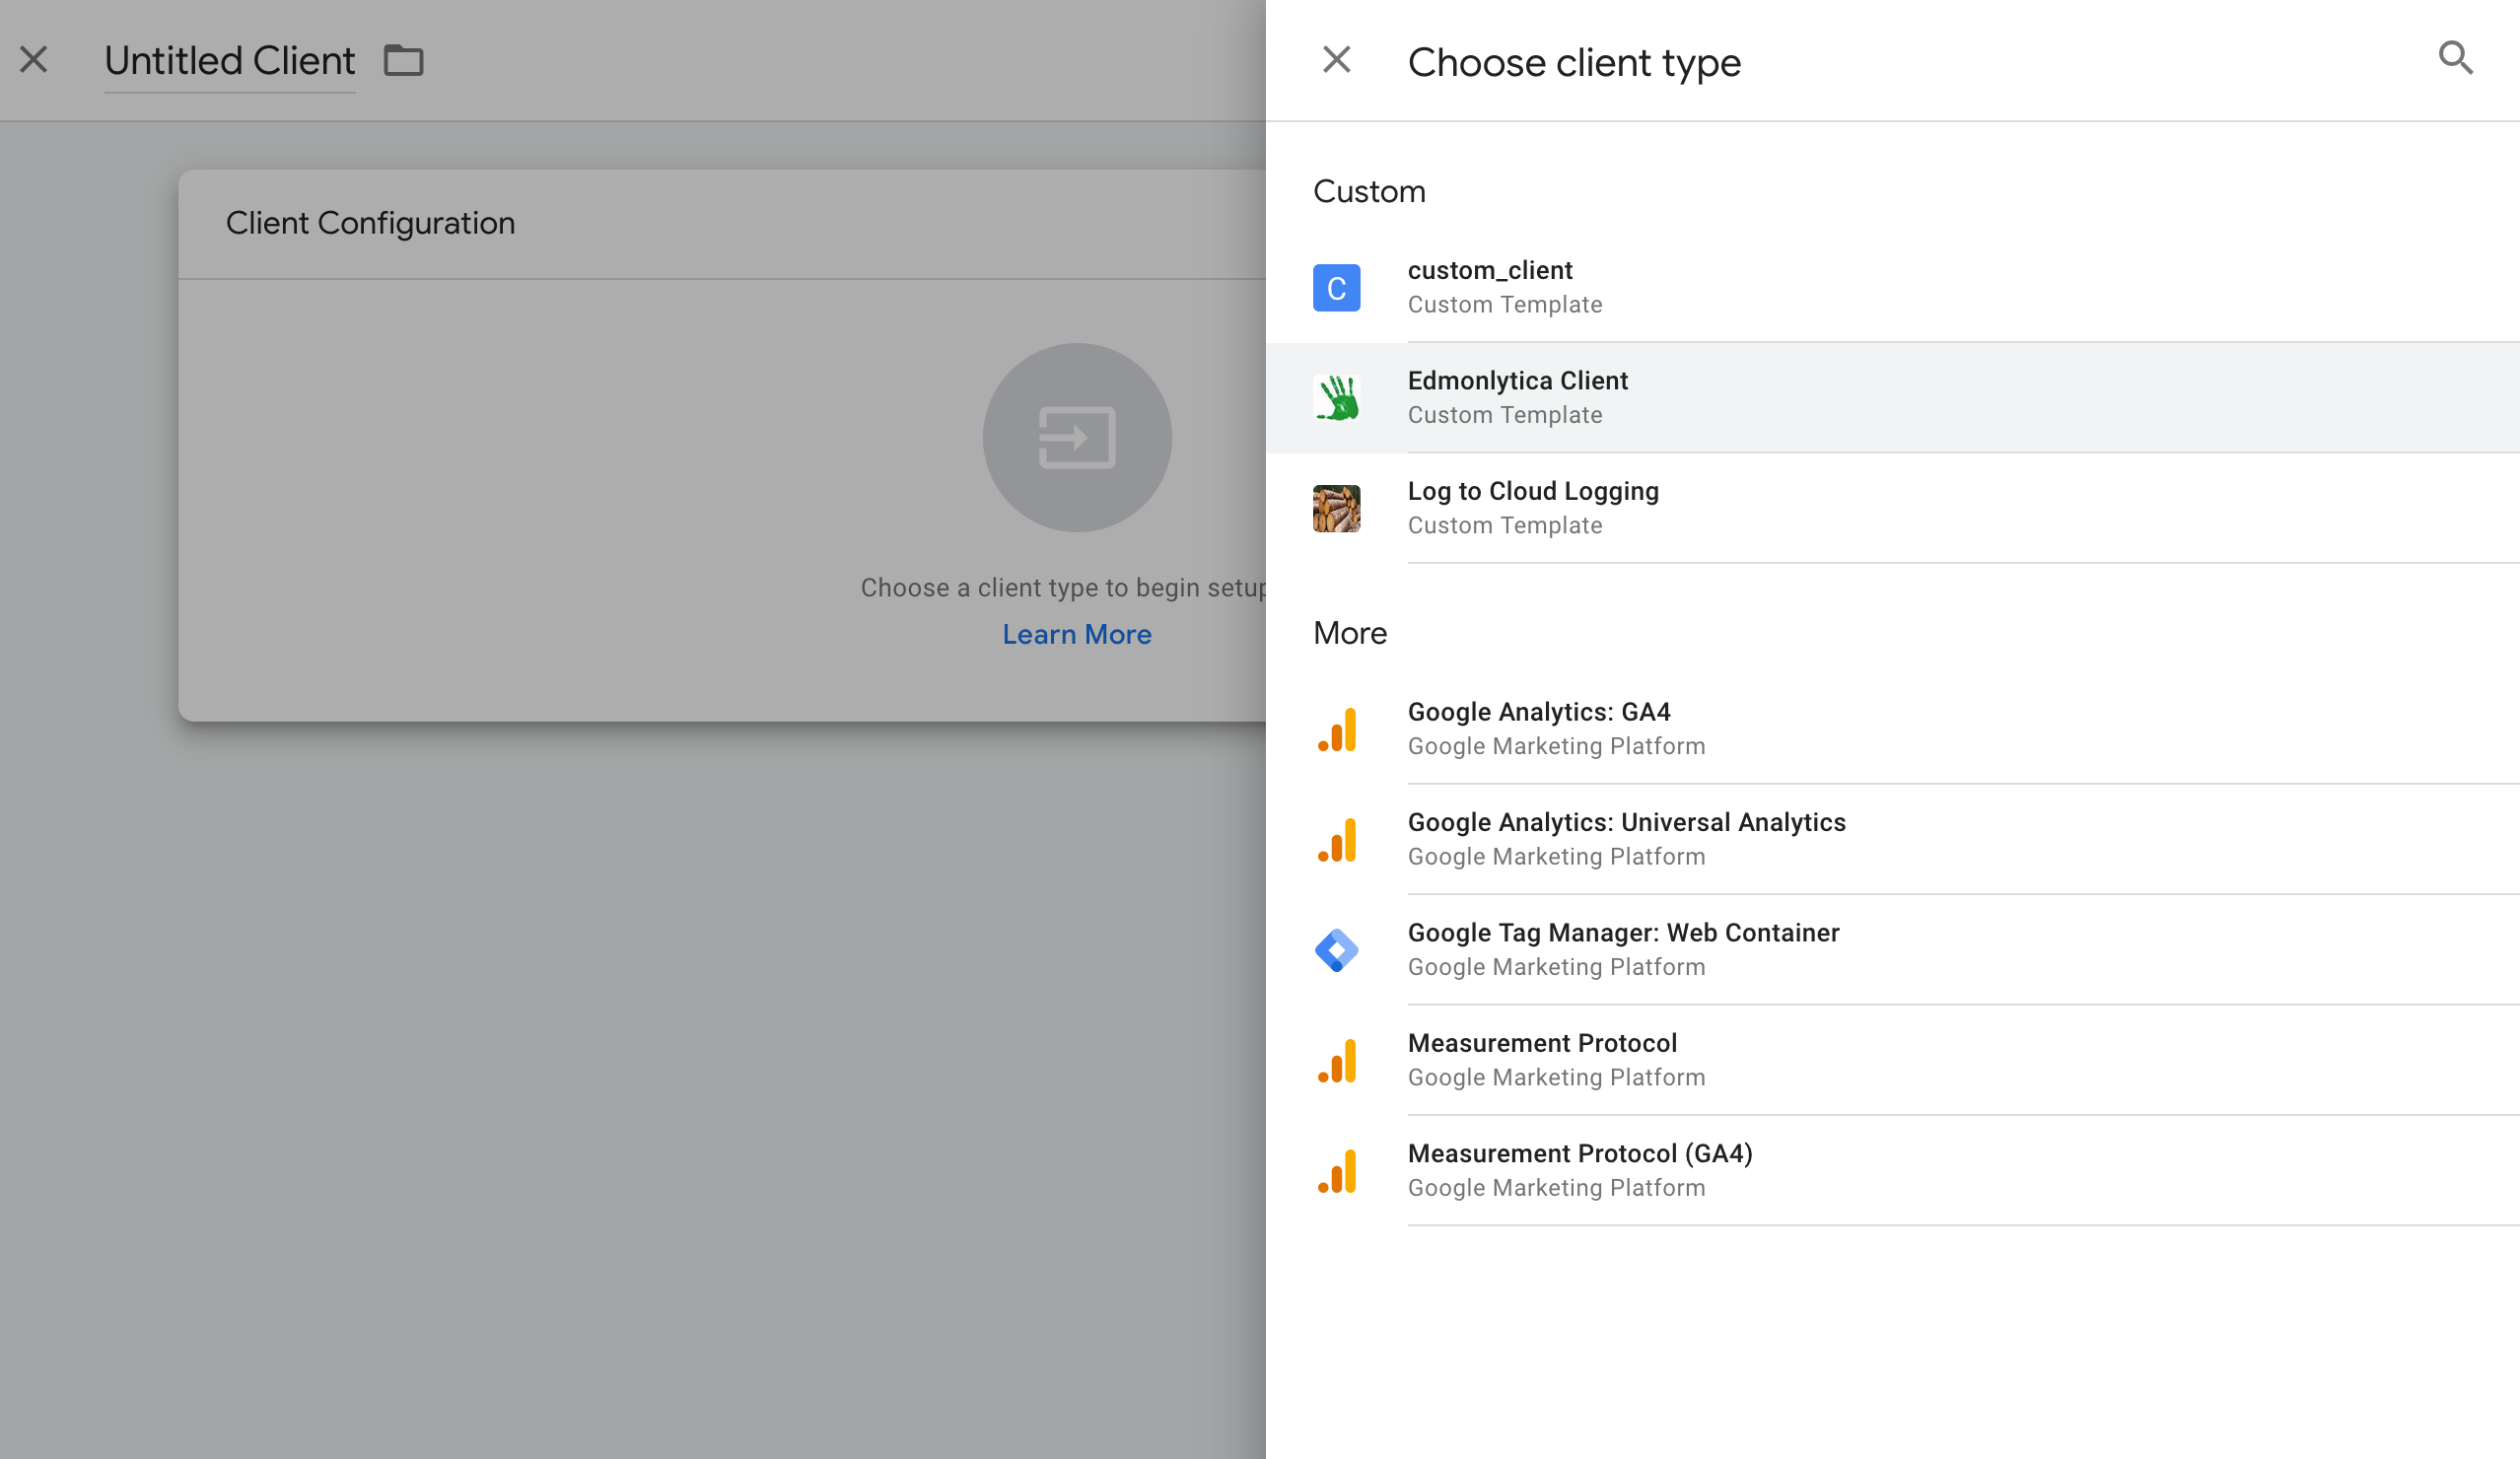
GTM Server Side
The GTM Server Side Client accepts calls from Edmonlytica GTM Browser Tag and parses them out into an GTM event object ready for server side tags to consume.
The GTM Server Side Tag will consume the event object and do the call to BigQuery.
The example below is using a GTM Server Side deployed on Cloud Run for 0 cost when within its free tier of 2 million requests per month.
Self Hosting GTM itself
As mentioned above, make sure to create a “Google Tag Manager: Web Container” as specified in the GTM Server Side documentation.
The GTM Server Side Client
The GTM Server Side Client accepts the endpoint request from the browser-side tag, puts it into an event format then runs it against the server-side tag. If successful, it returns a 200 response back to the browser as a pixel.
It includes a hashing of an anonymised ip address for a session/userId. This isn’t as reliable as using cookies for identifying sessions and users, but deemed fine for the scope of this use case. See these 4000 words on data privacy engineering and GTM server-side for background.
const claimRequest = require('claimRequest');
const getRequestPath = require('getRequestPath');
const getRequestQueryParameters = require('getRequestQueryParameters');
const log = require('logToConsole');
const runContainer = require('runContainer');
const returnResponse = require('returnResponse');
const setPixelResponse = require('setPixelResponse');
const sha256Sync = require('sha256Sync');
const getRemoteAddress = require('getRemoteAddress');

if(getRequestPath() == "/edmonlytica"){

  claimRequest();

  const ips = getRemoteAddress().split(".");
  const anon_ip = ips[1]+"."+ips[2]+"."+ips[3]+".000";

  const queryParameters = getRequestQueryParameters();
  const hashedip = sha256Sync(anon_ip + 'salted');

  // create event schema
  const event = {
    event_name: "edmonlytica",
    event:  queryParameters.event,
    referrer:  queryParameters.referrer,
    ts:  queryParameters.ts,
    eventId: queryParameters.eventId,
    custom: queryParameters.custom,
    sessionId: hashedip,
    page: queryParameters.page
  };

  log("Edmonlytica request event:", event);

  setPixelResponse();

  runContainer(event, () => returnResponse());

}
Remember to set the appropriate permissions as documented in the server side tagging APIs.
The GTM Server Side Tag
The Server Side tag will do the actual sending to BigQuery of your data.
const log = require('logToConsole');
const getAllEventData = require('getAllEventData');
const BigQuery = require('BigQuery');
const JSON = require('JSON');

// need a list of event data
const event = getAllEventData();

// this should match the BigQuery schema
let row = [];
row.push(event);

log('array to push to BigQuery: ', row);

BigQuery.insert({
  projectId: data.projectId,
  datasetId: data.dataset,
  tableId: data.table,
}, row, {}, () => {
  log('BigQuery Success');
  data.gtmOnSuccess();
}, (errors) => {
  log('BigQuery Failure');
  log(JSON.stringify(errors));
  data.gtmOnFailure();
});
Its possible to push many rows at once, but for this application it only does one at a time.
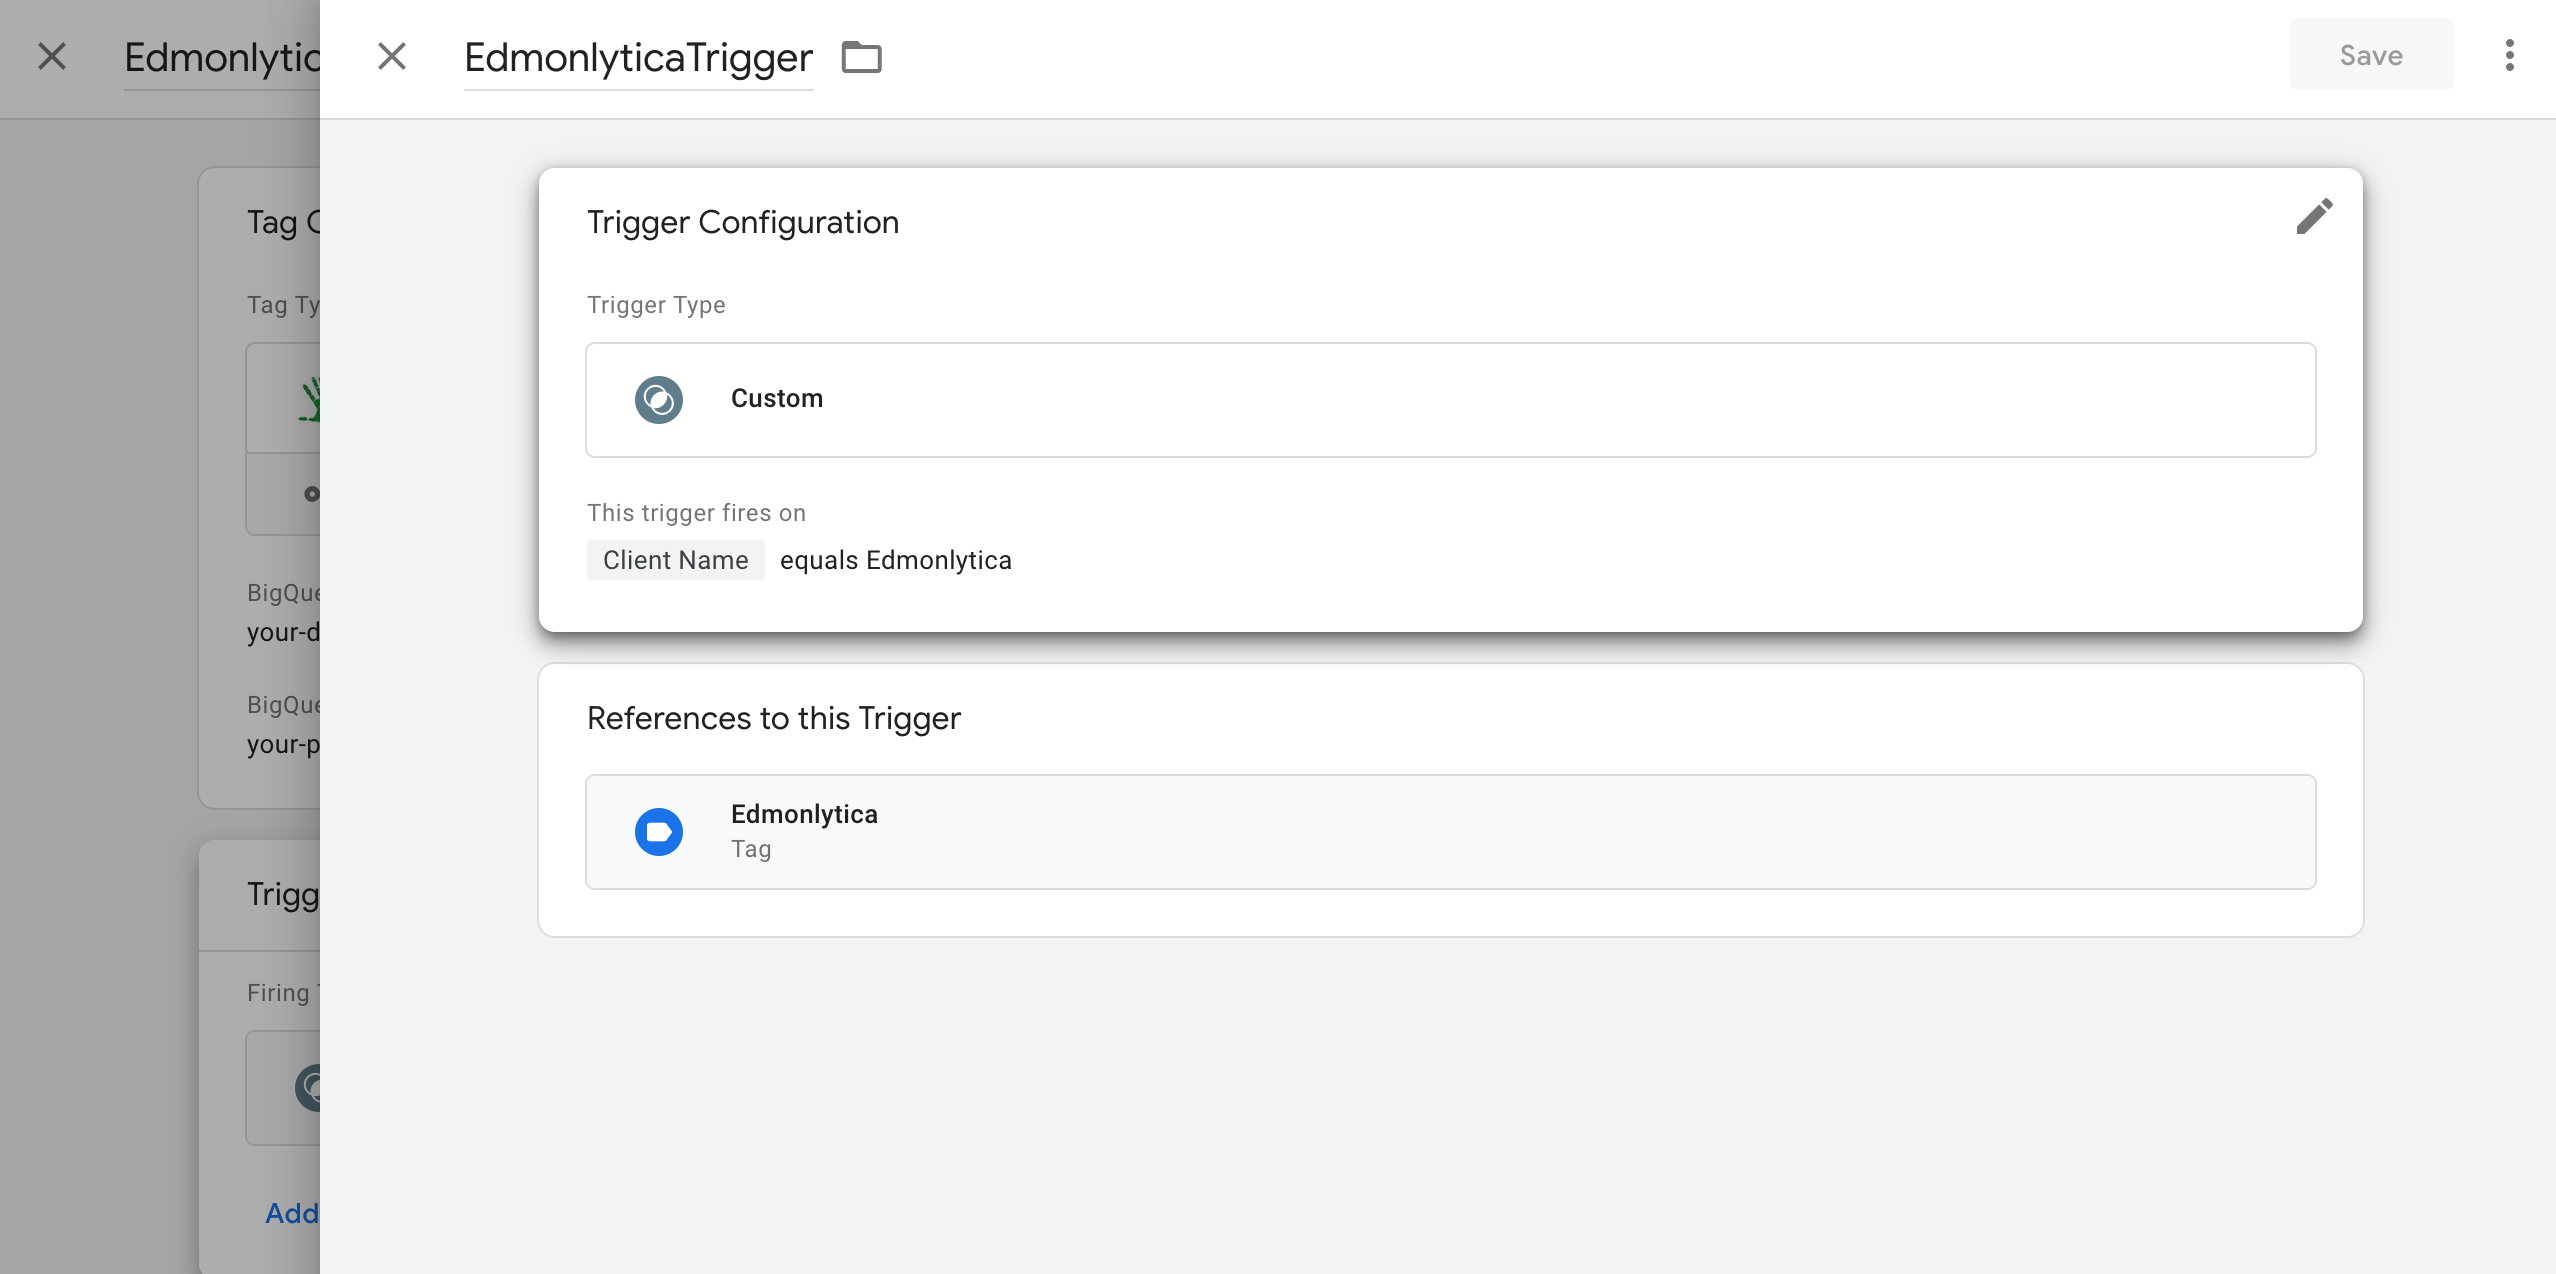
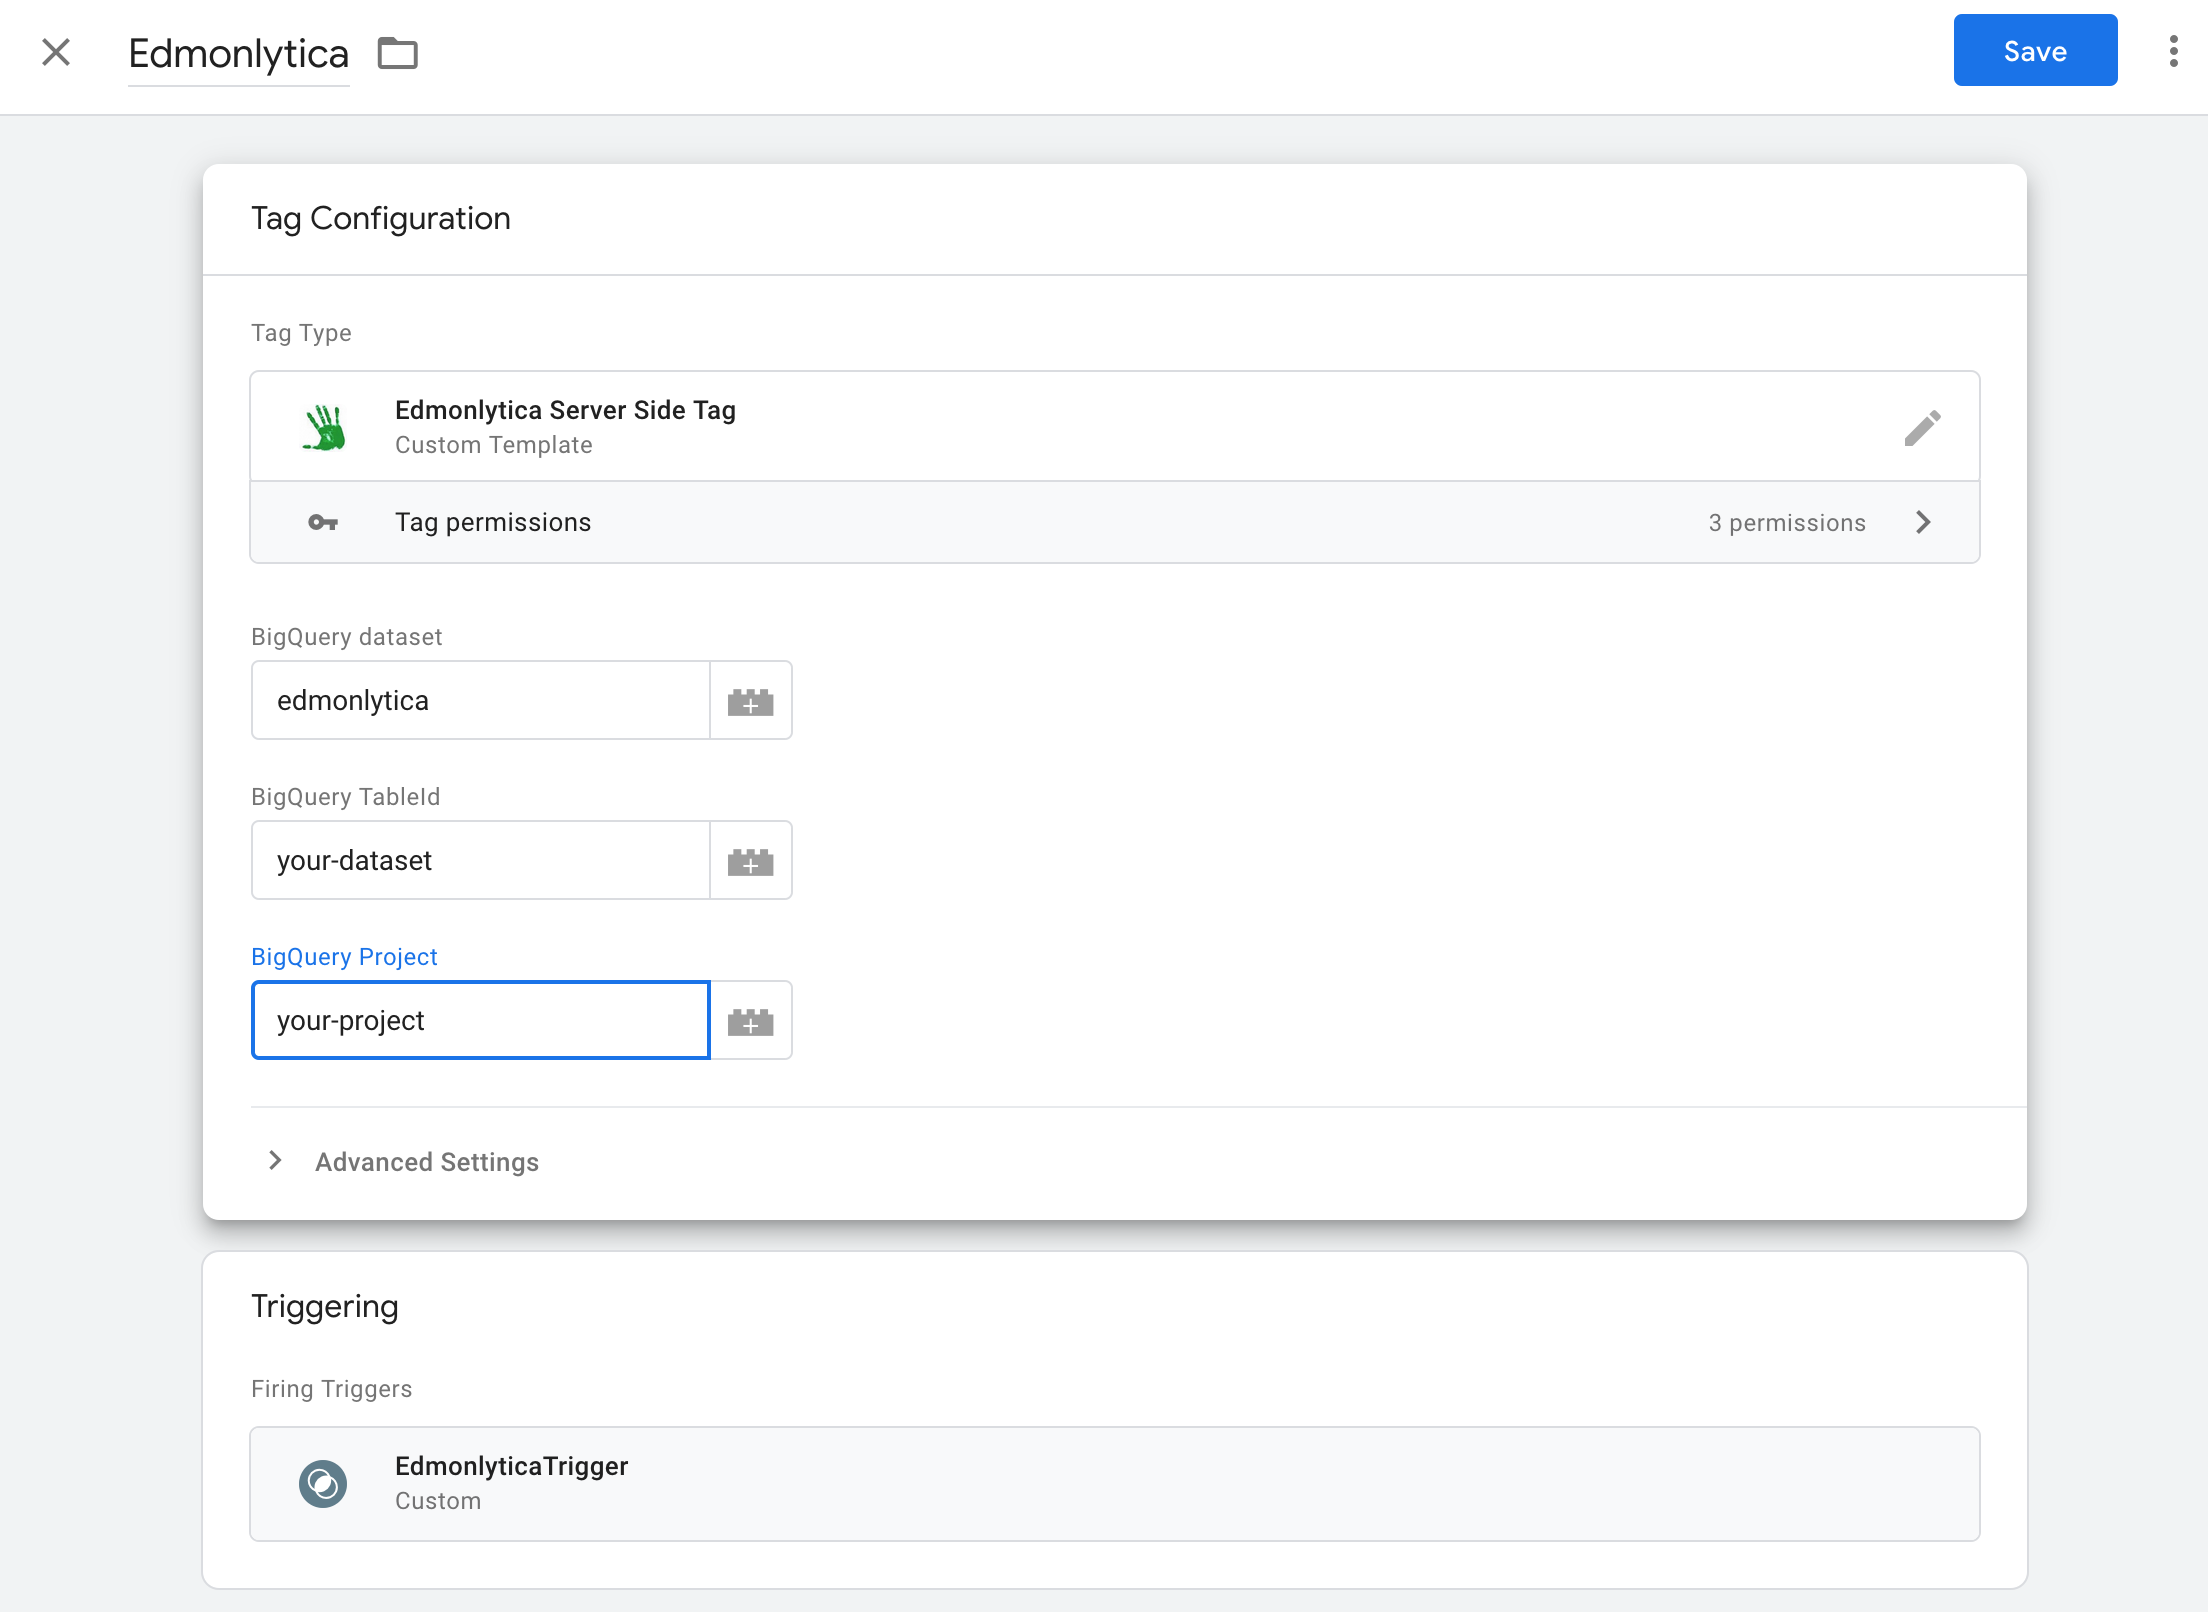
Once you have created the template, deploy the instances of them to the Clients and Tags and create a trigger:
BigQuery
The GTM tag won’t create the table, so you need to pre-create the schema. I also added DATE partitioning.
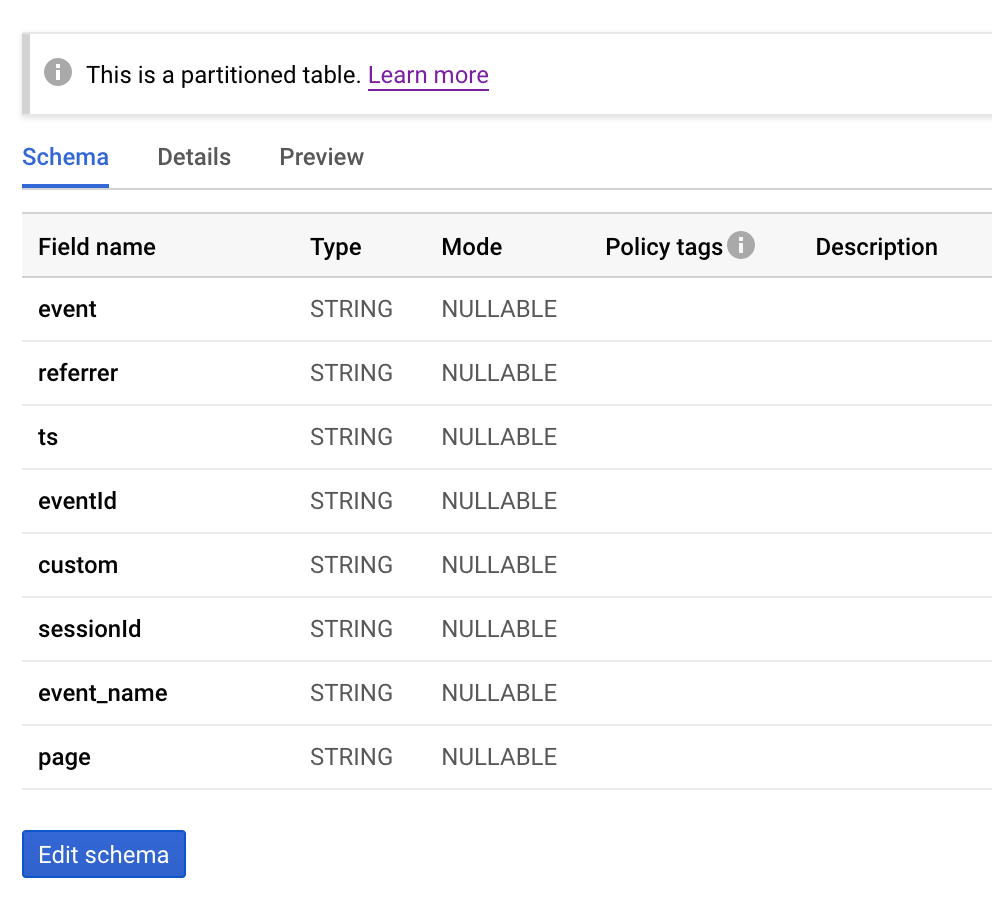
BigQuery schema
Once you have all your tags firing successfully in preview mode, you should start to see data in BigQuery. Study the GTM preview logs in the console if any problems, usually related to formatting the projectId/datasetId/tableId, the BigQuery data schema and similar.
Data will be flowing into the real-time BigQuery buffer, so you will want to disable cached results when testing your data stream. Queries like
SELECT * FROM `edmonlytica.code_markedmondson_me` LIMIT 1000Should give you back results.
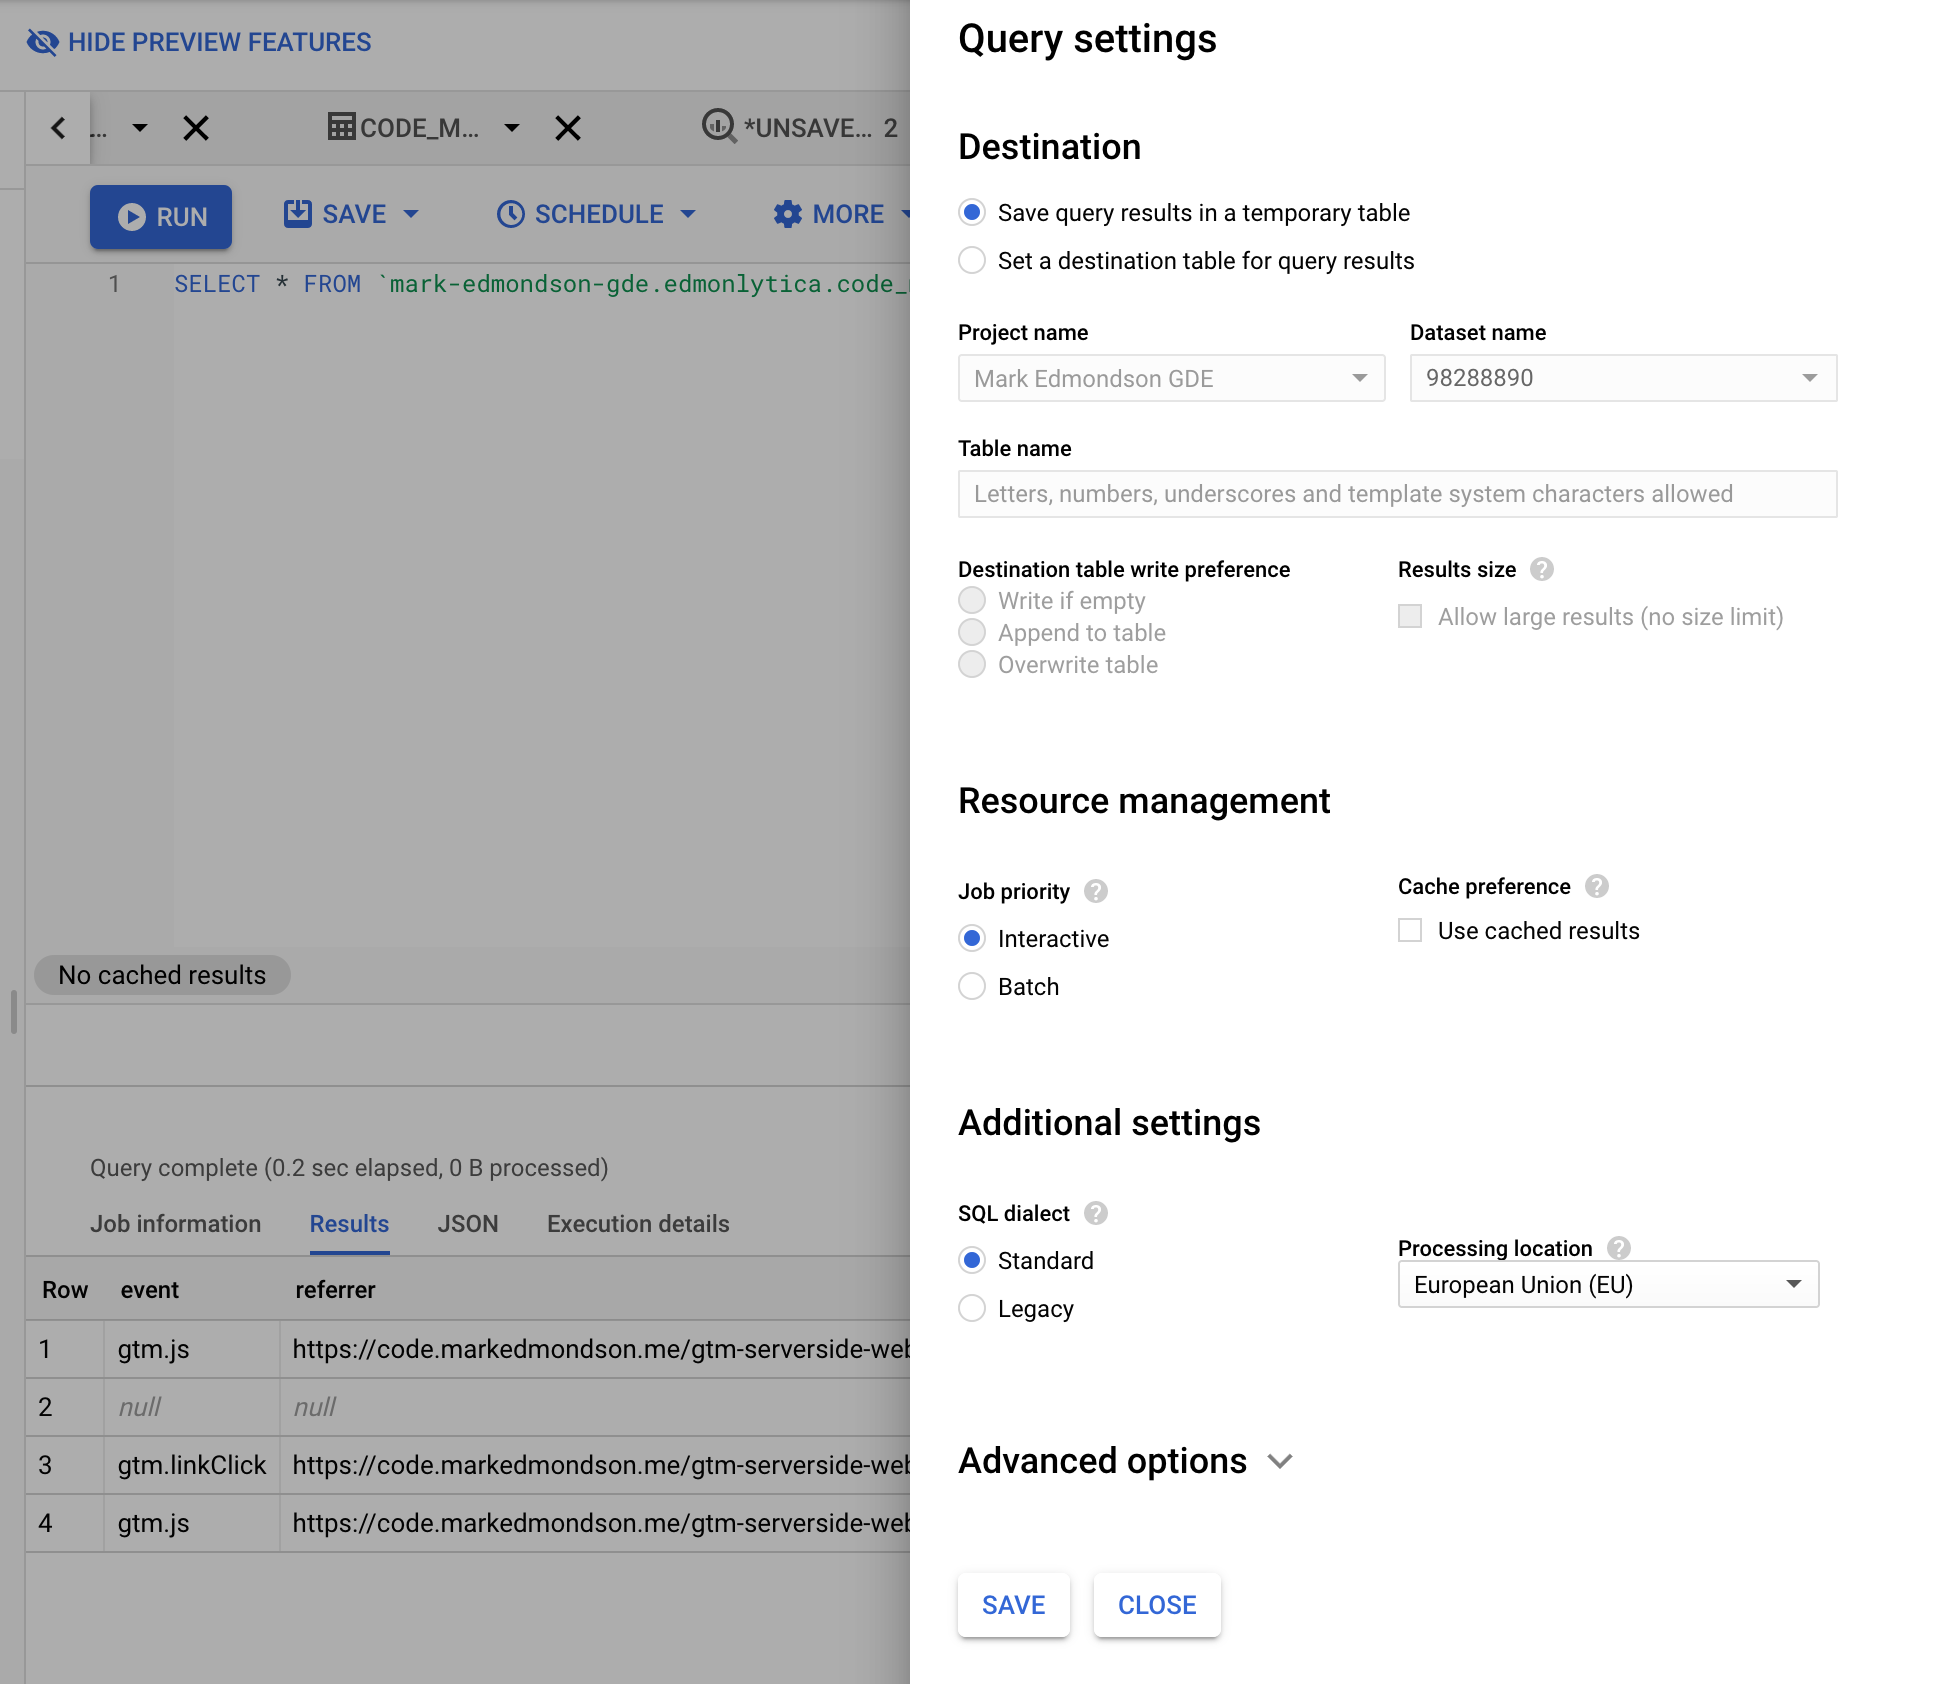
Untick the ‘Use cached results’ box
The hard bits done! Data should now be flowing in as users browse the website.
Handy SQL
This is where off-the-shelf analytics tools earn their keep by making these aggregations for you, but for simple data models like this it doesn’t take too long to extract some useful data tables. The common ones could be made into their own tables or views for convenience.
- Number of pageviews per YYYY-mm-dd hour
SELECT FORMAT_TIMESTAMP("%Y%m%d-%H00",
         TIMESTAMP_MILLIS(CAST(ts AS INT64))) AS timestamp,
         count(1) as pageviews
FROM `edmonlytica.code_markedmondson_me`
WHERE event = "gtm.js"
group by timestamp- Number of external link clicks per YYYY-mm-dd
SELECT custom as URL,
       FORMAT_TIMESTAMP("%Y%m%d",TIMESTAMP_MILLIS(CAST(ts AS INT64))) AS timestamp,
       count(1) AS linkClicks
FROM `edmonlytica.code_markedmondson_me`
WHERE event = "gtm.linkClick"
group by URL, timestamp- Number of unique hashed ips visiting from referrers per landing page
SELECT
  referrer, page,
  FORMAT_TIMESTAMP("%Y%m%d %H00",TIMESTAMP_MILLIS(CAST(ts AS INT64))) AS timestamp,
  COUNT(DISTINCT sessionId) AS visits
FROM
  `edmonlytica.code_markedmondson_me`
WHERE
  event = "gtm.js"
  AND page is not null
  AND referrer IS NOT NULL AND referrer != ""
  AND NOT STARTS_WITH(referrer, "https://code.markedmondson.me")
GROUP BY
  referrer, page, timestamp
You could connect to BigQuery with Data Studio or lots of other visualisation products, but I would like to connect via R Shiny.
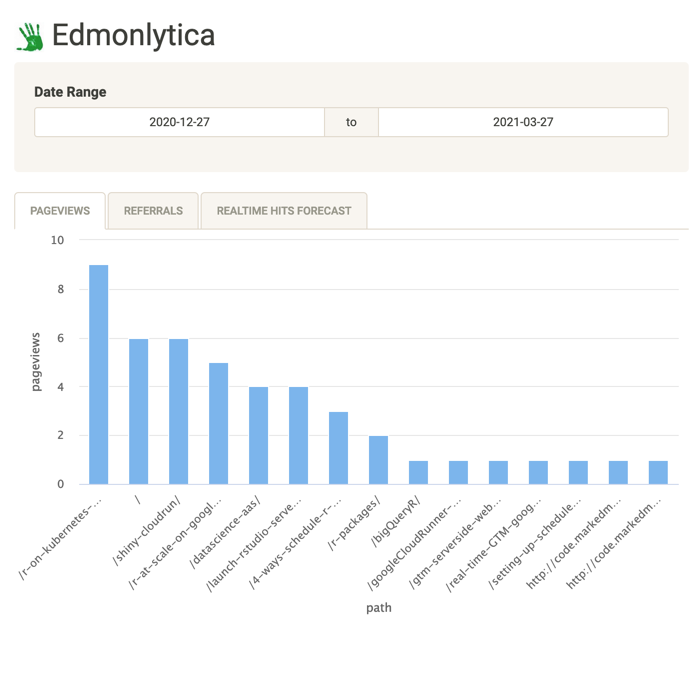
Shiny
I want to see my data in a Shiny dashboard. This app is deployed to Cloud Run as well. It includes visualizations of hit trends, top referrers and landing pages and some analysis tools such as forecasting.

pageviews per page
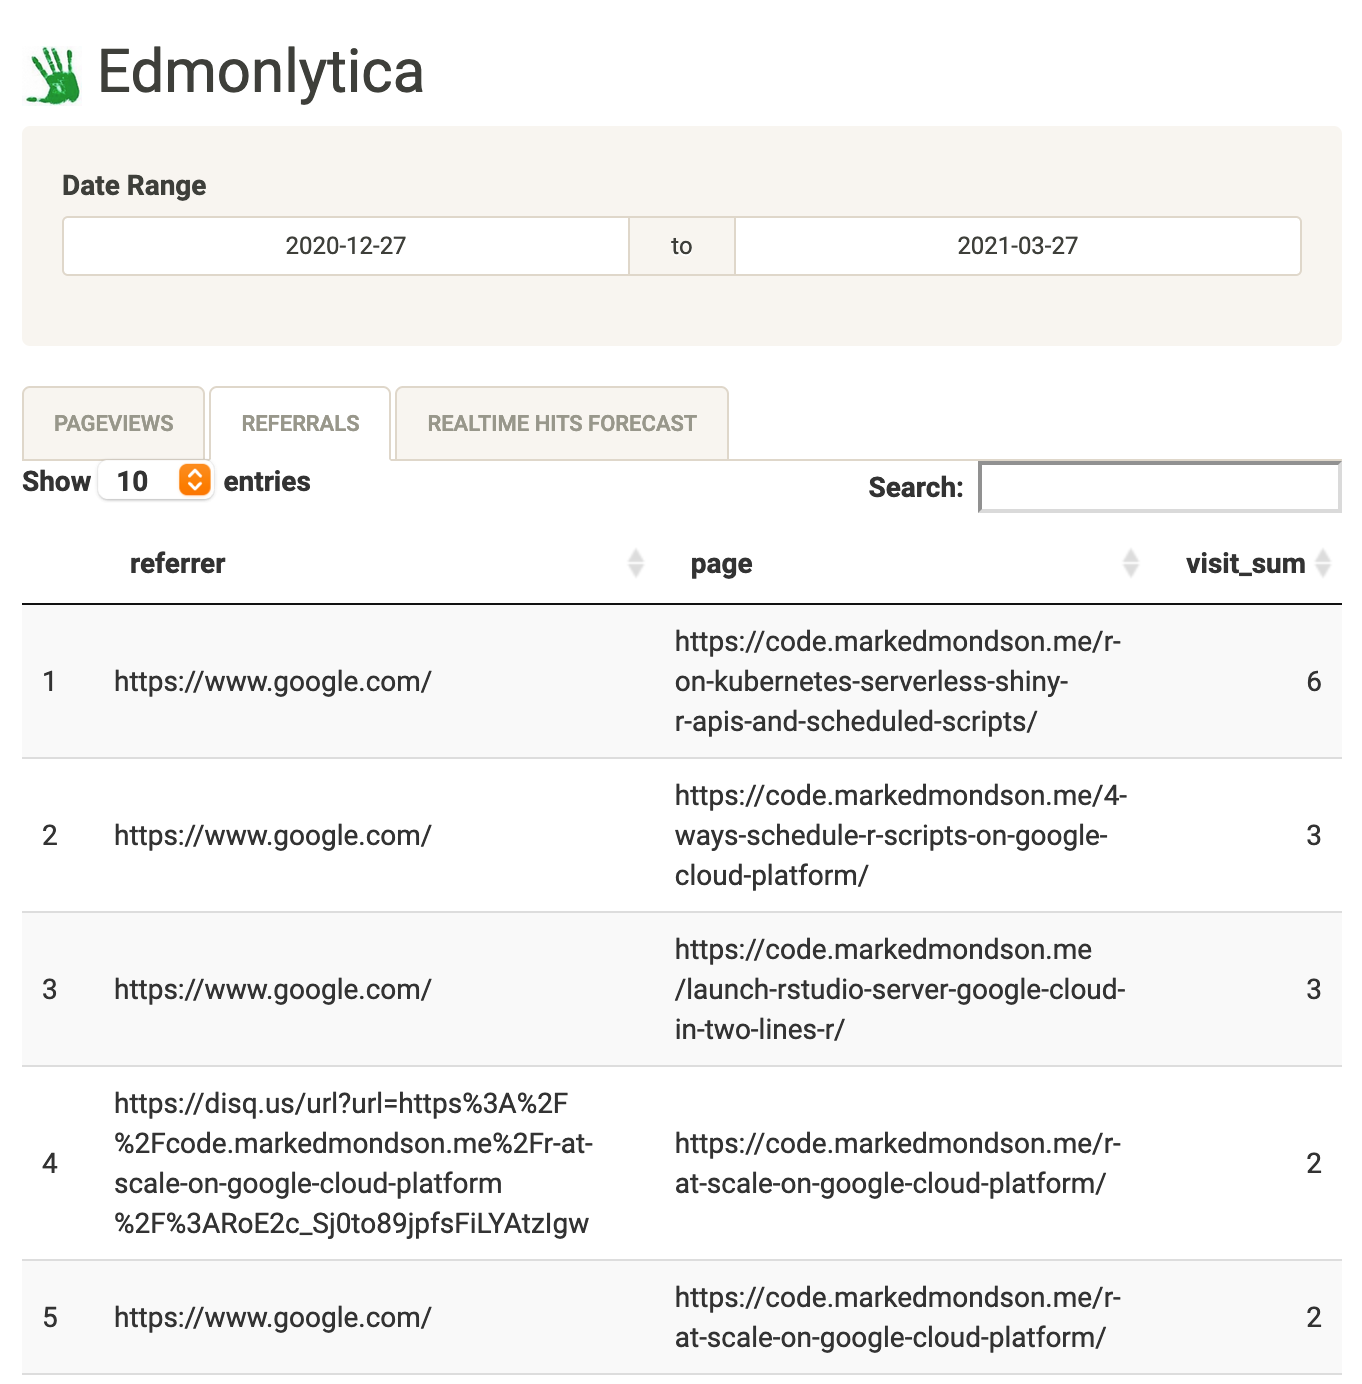
referrers and landing page
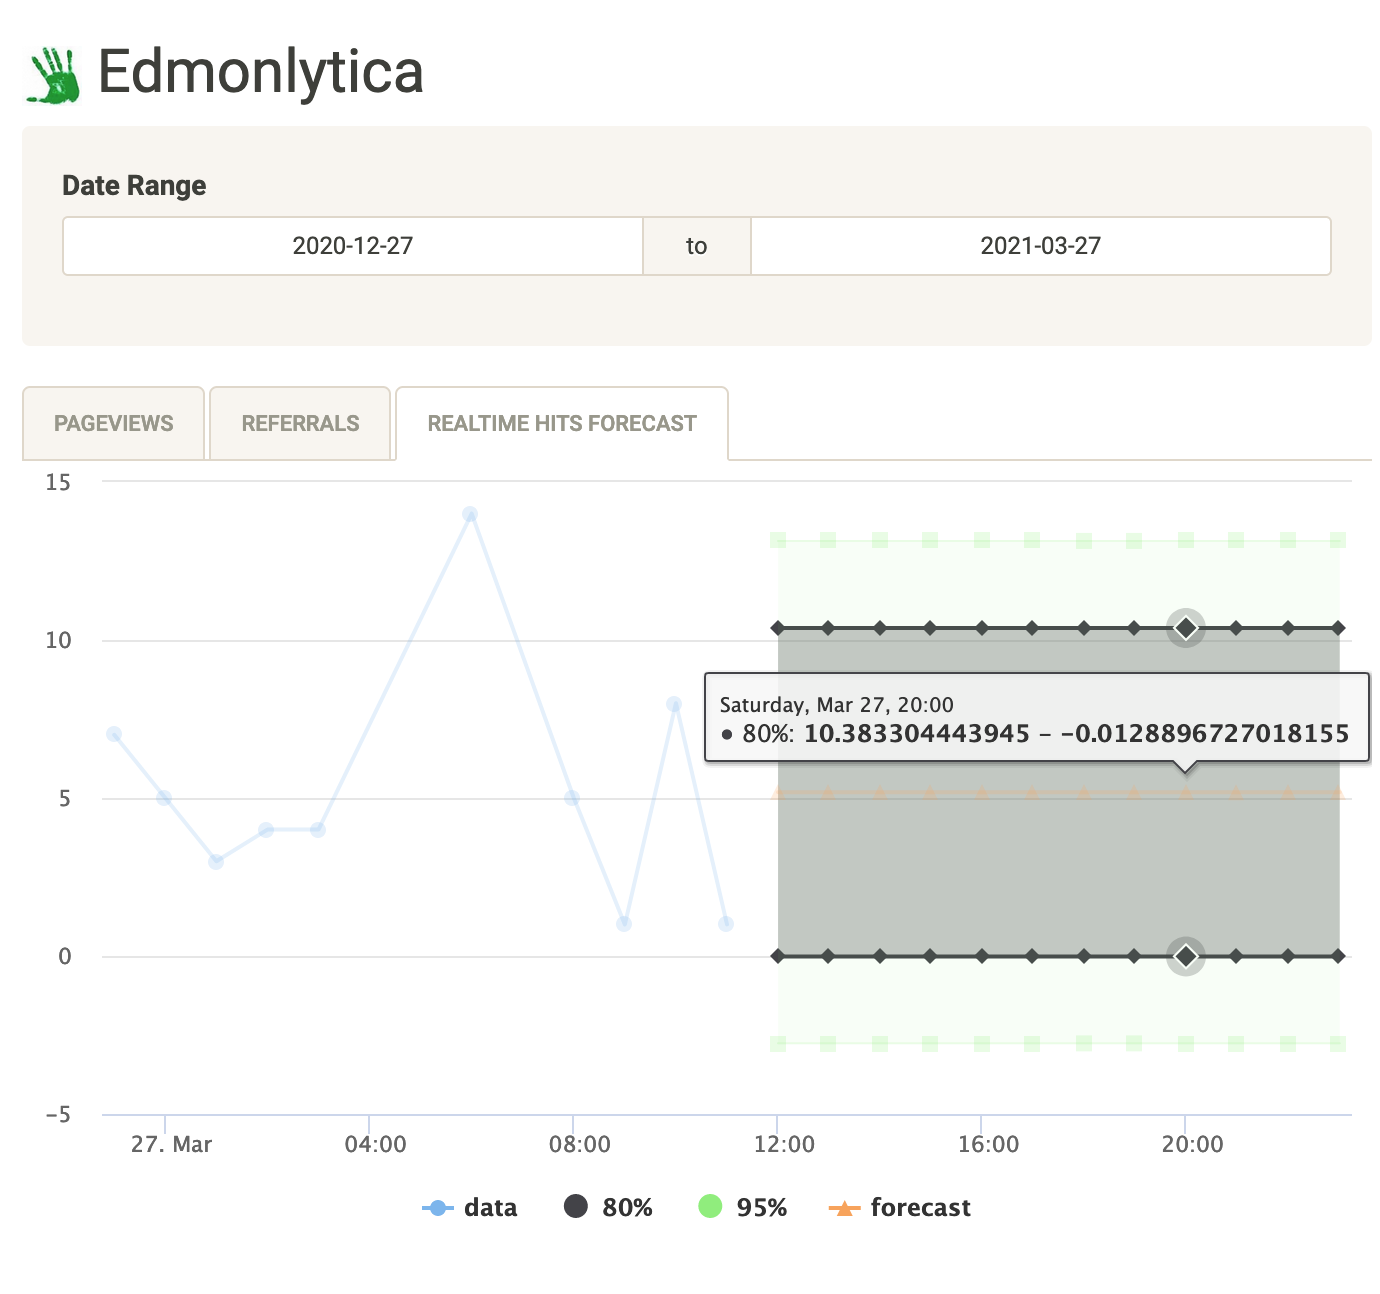
realtime hits and forecast
Shiny deployment on Cloud Run
The Shiny app code is here: https://github.com/MarkEdmondson1234/edmonlytica
I used the SQL examples above to help build the datasets for Shiny to process and display.
bigQueryR was used within my Shiny app, then since Cloud Run is running on GCP in the same project as the BigQuery dataset I could use googleAuthR::gar_gce_auth() to use the default authentication service account without needing to upload any auth keys.
I used highcharter as was used in my previous Shiny app (real-time forecasting dashboard using GTM, GCP and Shiny) as it makes pretty plots, and also kept the forecasting capabilities from that post for my trended hits via forecast.
The deployment followed the deploy Shiny on Cloud Run instructions and once the Dockerfile was built could be deployed by googleCloudRunner via:
library(googleCloudRuner)

# deploy to Cloud Run
cr_run(sprintf("gcr.io/%s/shiny-edmonlytica:latest",cr_project_get()),
       name = "shiny-edmonlytica",
       concurrency = 80,
       max_instances = 1,
       memory = "2Gi")
Summary
Creating your own digital analytics data flow is much easier these days as more and more useful tools come out. The Cloud is the enabler in most of these cases as it provides the scale but also cost savings - the most expensive aspect of the above setup will be the BigQuery query costs as for my blog it should otherwise keep well underneath the free tiers.
I hope it also demonstrates how other tools such as GA360 and GA4 can be complemented with your own data streams without too much development time, and look forward to the publication of lots of exciting pre-made GTM tags and clients in the Community Template Gallery to help even those with no coding experience benefit.