
The original intention for this blog was to announce updates to my R packages, but I tend to rely more on Twitter and other social media for that these days. A lot of documentation is also written for the package websites so I feel little need to put it on this blog as well.
But for googleAnalyticsR v1.0.0 there are so many cool new things that I think it deserves a bit more limelight. They are mostly the result of my R programming improving over the almost five years since version 0.1.1, the cool new tools available in the R ecosystem created by the R community plus the new capabilities of the Google Analytics APIs we’re connecting to.
Overview of cool features
As mentioned before the in-depth documentation is on the website:
- Google Analytics 4 support - Data API, Admin API and Measurement Protocol v2
- Shiny model templates - Create automatic Shiny dashboards from GA model objects
- Various UI tweaks and quality of life improvements - read it in the NEWS
For this blog post, I’ll then concentrate more on what you can do now that you couldn’t before.
Google Analytics 4 support
There is a video!
So yeah, basically you can now get GA4 in R, which in a couple of years will probably be the majority of digital analytics systems on the web.
I have to also thank Hadley for his drive-by issue on GitHub which pushed me to create a domain specific language (DSL) for googleAnalyticsR’s GA4 functions. The main benefit should be an intuitive UI you don’t need to look up all the time - e.g. unlike filter_clause_ga4() - I wrote the code and still need to look up how it works sometimes!
See a comparison on the same filters:
In the older reporting API you have to construct the filter object yourself with three different functions:
# reporting v4 filter
mf <- met_filter("bounces", "GREATER_THAN", 0)
mf2 <- met_filter("sessions", "GREATER", 2)

df <- dim_filter("source","BEGINS_WITH","1",not = TRUE)
df2 <- dim_filter("source","BEGINS_WITH","a",not = TRUE)

fc2 <- filter_clause_ga4(list(df, df2), operator = "AND")
fc <- filter_clause_ga4(list(mf, mf2), operator = "AND")

ga_v4 <- google_analytics(ga_id,
                          date_range = c("2015-07-30","2015-10-01"),
                          dimensions='source',
                          metrics = 'sessions',
                          met_filters = fc,
                          dim_filters = fc2)
In GA4, there is a more intuitive interface using a more tidyverse-like NSE:
fc2 <- ga_data_filter(!source %begins% "1" & !source %begins% "a")
fc  <- ga_data_filter(bounces > 0 & sessions > 2)

ga4_data <- ga_data(ga4_id,
                   date_range = c("2015-07-30","2015-10-01"),
                   dimensions='sessionSource',
                   metrics = 'sessions',
                   met_filters = fc,
                   dim_filters = fc2)
Workflows with GA4
Below is an example workflow using the GA4 APIs - the use case here is to analyse the first and last touch of users. It incorporates some of the new features of the API, such as the filters, creating your own dimensions and ordering the results. Personally I find it much easier to use, so it encourages more ‘flow’ in my analysis of the data.
library(googleAnalyticsR)
# ✓ Setting client.id from /Users/mark/clients/my_client.json
ga_auth()
# ℹ 2021-02-21 16:23:02 > Using email from GARGLE_EMAIL env var: me@email.com
# I've forgot my GA4 property Id so lets fetch them
al <- ga_account_list("data")## Auto-refreshing stale OAuth token.# ah yes this is my website
my_id <- 206670707
# what metrics/dimensions can I fetch again? Include my custom fields
custom_meta <- ga_meta("data", propertyId = my_id)## ℹ 2021-05-01 14:14:53 > Metadata for propertyId 206670707## ℹ 2021-05-01 14:14:54 > Caching new meta data# last year
last_year <- c("2020-01-01","2021-01-01")
# I want to cross reference first user source and last user source
ga_data(my_id,
metrics = "sessions",
date_range = last_year,
dimensions = c("firstUserMedium","sessionMedium"))## ℹ 2021-05-01 14:14:56 > Downloaded [ 29 ] of total [ 29 ] rows## # A tibble: 29 x 3
## firstUserMedium sessionMedium sessions
## <chr> <chr> <dbl>
## 1 organic organic 17557
## 2 (none) (none) 5750
## 3 referral referral 3982
## 4 organic referral 1165
## 5 (none) referral 951
## 6 (none) organic 656
## 7 referral organic 362
## 8 email email 246
## 9 organic (not set) 148
## 10 (none) (not set) 127
## # … with 19 more rows# what about only users from twitter? First check the sources
ga_data(my_id,
metrics = NULL, # to only return unique dimensions
date_range = last_year,
dimensions = "firstUserSource")## ℹ 2021-05-01 14:14:57 > Downloaded [ 100 ] of total [ 193 ] rows## # A tibble: 100 x 1
## firstUserSource
## <chr>
## 1 (direct)
## 2 127.0.0.1:17923
## 3 127.0.0.1:19409
## 4 127.0.0.1:20644
## 5 127.0.0.1:21594
## 6 127.0.0.1:23734
## 7 127.0.0.1:23960
## 8 127.0.0.1:25447
## 9 127.0.0.1:25537
## 10 127.0.0.1:28513
## # … with 90 more rows# oh dear lots of ip address - lets filter those out
ip_filter <- ga_data_filter(!firstUserSource %begins% "127.0.0.1")
ga_data(
my_id,
metrics = NULL,
date_range = last_year,
dimensions = "firstUserSource",
dim_filters = ip_filter, # apply filter
limit = -1) # all results## ℹ 2021-05-01 14:14:58 > Downloaded [ 167 ] of total [ 167 ] rows## # A tibble: 167 x 1
## firstUserSource
## <chr>
## 1 (direct)
## 2 185.199.111.153:6080
## 3 34.66.89.215
## 4 ActiveCampaign
## 5 ConversionWorksBlog
## 6 Data_Elixir_222
## 7 Iterable
## 8 aboutdata.atlassian.net
## 9 adelachrist.top
## 10 affecheafe
## # … with 157 more rows# twitter filter: list shows 't.co', 'twitter' and 'twitter.com'
twit <- ga_data_filter(firstUserSource == c("twitter","twitter.com","t.co"))
# did anyone who first arrived by Twitter later come back via other channels?
ga_data(
my_id,
metrics = "sessions",
date_range = last_year,
dimensions =
c("firstUserSource",
lastMediumSource = "sessionMedium/sessionSource"), #dynamic dimension
dim_filters = twit)## ℹ 2021-05-01 14:15:00 > Downloaded [ 15 ] of total [ 15 ] rows## # A tibble: 15 x 3
## firstUserSource lastMediumSource sessions
## <chr> <chr> <dbl>
## 1 t.co referral/t.co 801
## 2 t.co referral/code.markedmondson.me 73
## 3 t.co organic/google 41
## 4 t.co (none)/(direct) 8
## 5 t.co referral/disq.us 7
## 6 twitter social/twitter 7
## 7 t.co referral/github.com 4
## 8 t.co (not set)/(not set) 2
## 9 t.co social/meetedgar.com 2
## 10 t.co referral/alexbirkett.com 1
## 11 t.co referral/linkedin.com 1
## 12 t.co referral/mark.shinyapps.io 1
## 13 t.co referral/markedmondson.me 1
## 14 t.co referral/rweekly.org 1
## 15 twitter.com social/twitter.com 1# lets take out self referrals and those coming back by twitter
me <- ga_data_filter(!sessionSource %contains% "markedmondson.me")
nottwit <- ga_data_filter(!sessionSource == c("twitter","twitter.com","t.co"))
# and change the metrics/dimensions
ga_data(
my_id,
metrics = c("engagementRate","activeUsers"),
date_range = last_year,
dimensions =
c("unifiedScreenName",
lastMediumSource = "sessionMedium/sessionSource"), #dynamic dimension
dim_filters = ga_data_filter(twit & me & nottwit), # combine filters
orderBys = ga_data_order(-activeUsers) # order by activeUsers metric
)## ℹ 2021-05-01 14:15:01 > Downloaded [ 40 ] of total [ 40 ] rows## # A tibble: 40 x 4
## unifiedScreenName lastMediumSource engagementRate activeUsers
## <chr> <chr> <dbl> <dbl>
## 1 Mark Edmondson organic/google 1 6
## 2 Welcome to bigQueryR organic/google 0.5 5
## 3 Launch RStudio Server in the Goo… organic/google 0.5 4
## 4 Google Tag Manager Server Side o… organic/google 0.4 4
## 5 Introducing googleCloudRunner - … organic/google 0.4 4
## 6 Shiny on Google Cloud Run - Scal… (none)/(direct) 1 3
## 7 Five Ways to Schedule R scripts … organic/google 0.8 3
## 8 BigQuery Queries organic/google 0 3
## 9 Google Tag Manager Server Side o… (none)/(direct) 1 2
## 10 Turning GA360 BigQuery exports i… organic/google 1 2
## # … with 30 more rowsSo for Twitter first time referrals, it seems most people used Google to come back to visit my home page, which is not surprising.
Sending in Measurement Protocol hits and seeing them in real-time
The Measurement Protocol v2 for GA4 is less open and so can’t be spammed. It works using a server key so it seems useful to include in the package. Thank Martijn van Vreeden for the encouragement in making this feature.
googleAnalyticsR includes functions to call the measurement Protocol API, but it itself depends on a smaller library (new on CRAN v0.1.0) dedicated to measurementProtocol hits. This is so you can use the measurement protocol without needing to import all the other dependencies googleAnalyticsR uses, which can be quite heavy as its focused on usability of the data.
Once you have the measurement ID and stream secret then you can send in events associated with a clientId like so:
# preferably set this in .Renviron - take from the webUI
Sys.setenv(GA_MP_SECRET="MY_SECRET")

# your GA4 settings
my_measurement_id <- "G-43MDXK6CLZ"
my_connection <- ga_mp_connection(my_measurement_id)

a_client_id <- ga_mp_cid()

event <- ga_mp_event("an_event")
ga_mp_send(event, a_client_id, my_connection, debug_call = TRUE)
As we also have the real-time API incorporated, it can be quickly verified which hits are going in:
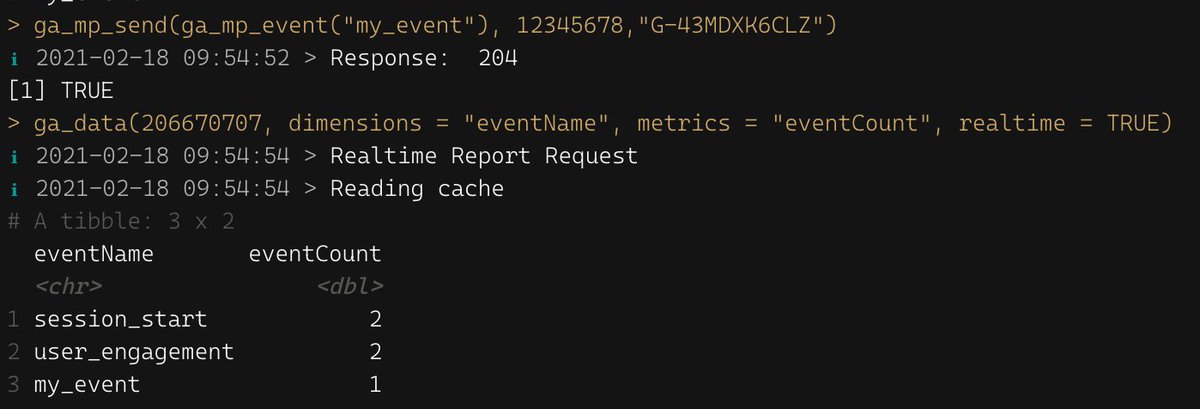
This has wide applications to send in analytics hits with R, such as adding customer segments to GA4 BigQuery exports using R to model the clusters.
It is also compatible with GTM server-side, which can hold a measurement protocol client. Simply change your mp_connection object to point at your GTM endpoint instead:
# custom GTM server side endpoint
my_custom_connection <- mp_connection(
   my_measurement_id,
   endpoint = "https://gtm.example.com",
   preview_header = "ZW52LTV8OWdPOExNWFkYjA0Njk4NmQ="
 )
This holds many possibilities for enriching your data streams.
Tracking usage of googleAnalyticsR
One use case for the measurement protocol I have implemented is using it to track usage of the googleAnalyticsR library itself. I asked and got feedback that the digital analytics community using the library are ok with tracking if its opt-in and no personal data.
This gives birth then to the ga_trackme() function which allows people to opt-in to tracking each time the library is loaded via the ga_trackme_event() function. Users can see what is sent by calling ga_trackme_event(debug_call=TRUE):
ℹ 2021-03-05 09:36:46 > MP Request: https://www.google-analytics.com/debug/mp/collect?measurement_id=G-XXX&api_secret=_XXXXXX
 {
  "client_id": "XXXXXX",
  "non_personalized_ads": true,
  "events": {
    "name": "googleanalyticsr_loaded",
    "params": {
      "r_version": "R version 3.6.3 (2020-02-29)",
      "r_platform": "x86_64-apple-darwin15.6.0 (64-bit)",
      "r_locale": "en_US.UTF-8/en_US.UTF-8/en_US.UTF-8/C/en_US.UTF-8/en_US.UTF-8",
      "r_system": "macOS  10.16",
      "package": "googleAnalyticsR 0.8.0.9000"
    }
  }
}
ℹ 2021-03-05 09:36:46 > Response:  200
And I thought it would be fun for people to have the option of sending their own messages to my GA4 account so it includes a say_hello argument:
ga_trackme_event(debug_call=TRUE, say_hello = "Hello from Denmark!")
...
 {
  "client_id": "XXXXX",
  "non_personalized_ads": true,
  "events": {
    "name": "googleanalyticsr_loaded",
    "params": {
      ...
      "say_hello": "Hello from Denmark!",
      ...
    }
  }
}
I can use the info to see what systems and versions of the library are being used over time.
Shiny Model Templates
I should do a video of this stuff, and will do when I can and update this sentence.
A reminder about ga_model()
I think its probably only me who is using ga_model() at the moment, but I hope that the utility of these Shiny functions will help drive adoption (please comment if you do use them!) as I think they are a bit of an undiscovered gem within the googleAnalyticsR package.
As I’ve described before, I enjoy finding the meta of the thing I am doing now, and for googleAnalyticsR that has developed into an idea of it not just being able to download GA data, but becoming a platform for analysis of that data too.
Democratising advanced statistical and modelling tools so they are more easily available could potentially drive up the value of the GA API data, and this is what the ga_model() function offers - others can create the analysis and package it up into special .gamr files, and you can call that analysis to your own data by downloading that .gamr file and supplying your own GA viewID.
Take for example this great practical analysis created by Tim Wilson within Dartistics to show the velocity of pageviews for different type of content - now not only can you read the code but try it out on your data.
library(googleAnalyticsR)

tn_model <- ga_model_example("time-normalised.gamr")

# replace with your own GA viewId
view_id <- 81416156
result <- ga_model(view_id, tn_model,
                   page_filter_regex = "/googleAnalyticsR/",
date_range = c("2021-01-01","2021-02-01"))result$plotTo seed this I am always thankful when anyone blogs or writes about googleAnalyticsR’s usage, so my idea is to take the code from some of those tutorials (see googleAnalyticsR’s homepage tutorial section) and convert them into .gamr files like above - let me know if you’d like to contribute, either as further examples kept within the package or stored elsewhere.
The new ga_model_shiny() feature - Shiny Apps!
A natural next step is to present that analysis. Shiny provides a route to this by enabling responsive web dashboards, but Shiny is definitely a steep learning curve. I look to flatten that curve with the ability to re-use and swap out models and Shiny templates easily.
googleAnalyticsR now provides a framework for people to share Shiny themes on top of the ga_models available - it should be the simplest way to make Shiny apps out of GA data.
The ga_models and Shiny themes can be combined to make Shiny apps with pre-made features such as OAuth2 login, caching and date pickers. Quick iteration between styles is possible and even for advanced users this should lower development time for advanced GA dashboard applications.
Some quick examples of the same model being used with different example templates - the major point being you can swap between totally different Shiny UI themes with just one line of code:
- Shinythemes
m3 <- ga_model_example("time-normalised.gamr")
m4 <- ga_model_example("ga-effect.gamr")

ga_model_shiny(list(m4, m3),
               auth_dropdown = "universal",
               template = ga_model_shiny_template("shinythemes"),
               theme = "cerulean")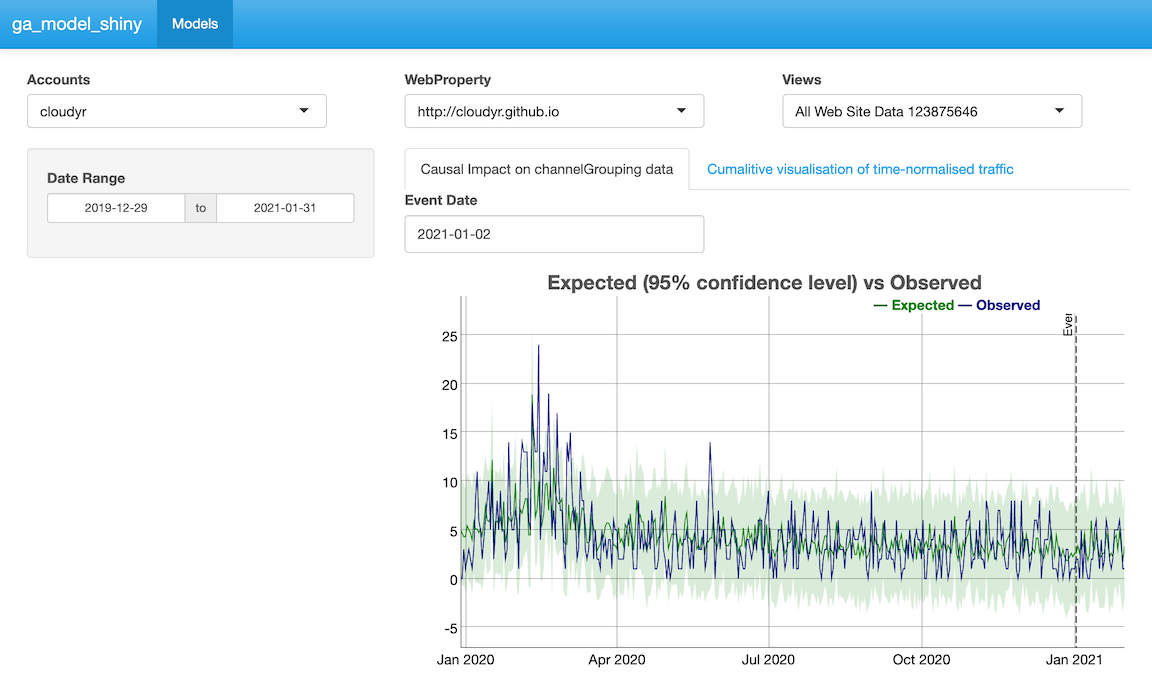
- bslib
m3 <- ga_model_example("time-normalised.gamr")
m4 <- ga_model_example("ga-effect.gamr")

ga_model_shiny(list(m4, m3), auth_dropdown = "universal",
               template = ga_model_shiny_template("basic_bslib"),
               bg = "white", fg = "red", primary = "grey")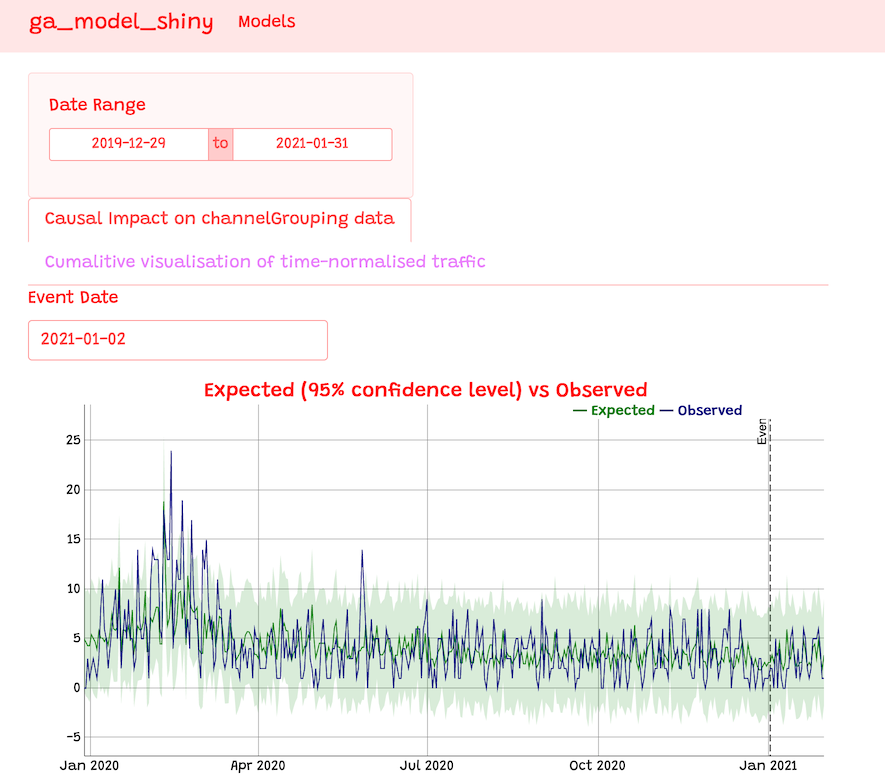
- argonDash
model <- ga_model_example("ga-effect.gamr")

ga_model_shiny(
  model,
  title = "Argon Demo",
  auth_dropdown = "universal",
  template = ga_model_shiny_template("argonDash"))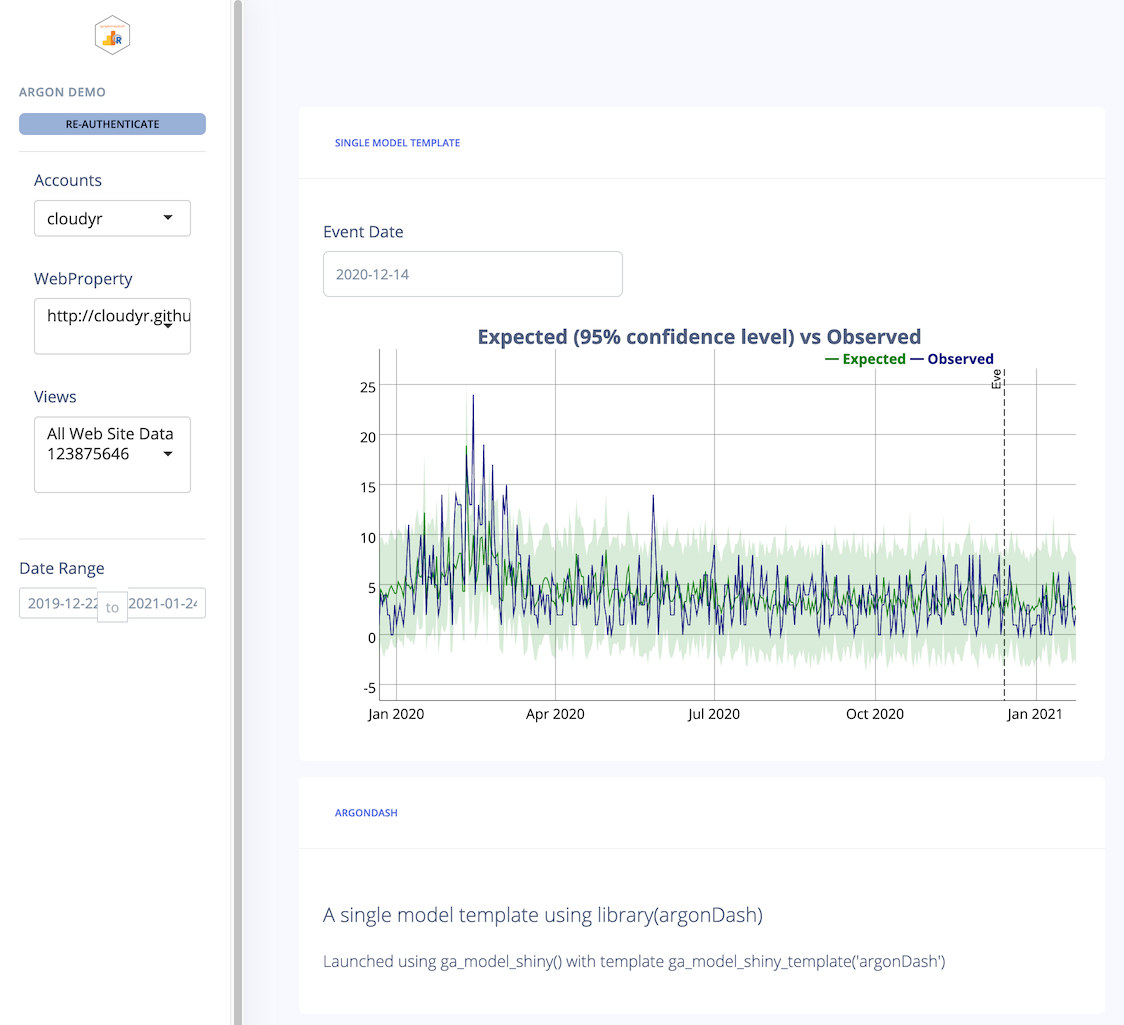
In particular, the Shiny apps created are all using the latest Shiny 1.6 features, such as Shiny Modules, bindCache() and styling via bslibs so you have access to advanced Shiny features without needing to code them, and of course the latest thinking of OAuth2 authentication from my own googleAuthR using gar_shiny_auth() etc. is incorporated. The Shiny apps can be exported to code so you can tweak them as you require, and written to a folder including a Dockerfile for deployment to your favourite Shiny hosting solution. I’m using googleCloudRunner’s Shiny deployments on Cloud Run.
All the other stuff
As usual there are also lots of minor changes that are the result of user feedback or fixing minor frustrations when I am using the package.
- No need for client Id when doing authentication with a service key JSON file - should make it smoother for authenticating Rmd files on a server
- Cleaner NAMESPACE for finding help files - the auto-complete should throw up more useful functions
- Nicer looking messaging in the R console - the
clipackage has been used more extensively to give more attractive message feedback with attractive green ticks etc. - Dev website - from this release there will be a dev website with all GitHub changes (https://code.markedmondson.me/googleAnalyticsR/dev/) but the CRAN version will only hold the ‘official’ docs (https://code.markedmondson.me/googleAnalyticsR/)
Summary
I’d like to thank all the people who have used googleAnalyticsR up until now and especially those who have given feedback on how they use it. Its been my introduction to open-source and I’ve got a lot out of it - it feels good to contribute to the R and Digital Analytics community.
If you have any ideas on what else could be done with the package (or find a bug!) please do let me know via Twitter at HoloMarkeD, the #googleAuthRverse Slack group or via GitHub issues.