Adding Google Data Studio Dashboards to RMarkdown
This week I learnt you can take Google Data Studio reports and, via their embed feature, paste them straight into an RMarkdown HTML document.
This is cool as you can then combine the strengths of both for client reports or similar.
Data Studio is a free online solution, that I have found to be very quick to get something decent looking. It also has excellent connectors to data sources that can be difficult to get access to otherwise, such as DoubleClick. I often use it when working with BigQuery by linking via its BigQuery connector (takes 10 seconds) and then plotting to examine the data trends.
However, Data Studio isn’t suitable for more advanced analysis or custom visualisations, so the fact you can put them in RMarkdown documents means you can then combine its reports alongside more in-depth analysis within R, side by side with advanced R plotting such as ggplot2, htmlwidgets or plot.ly. RMarkdown excels as a way to document your analysis steps, and I often use it as a way to keep a working document I can check into GitHub that contains all the SQL, code and assumptions of an analysis.
How to add Data Studio to RMarkdown
First create your Data Studio report, then select the “Embed” option top right of Google Data Studio:
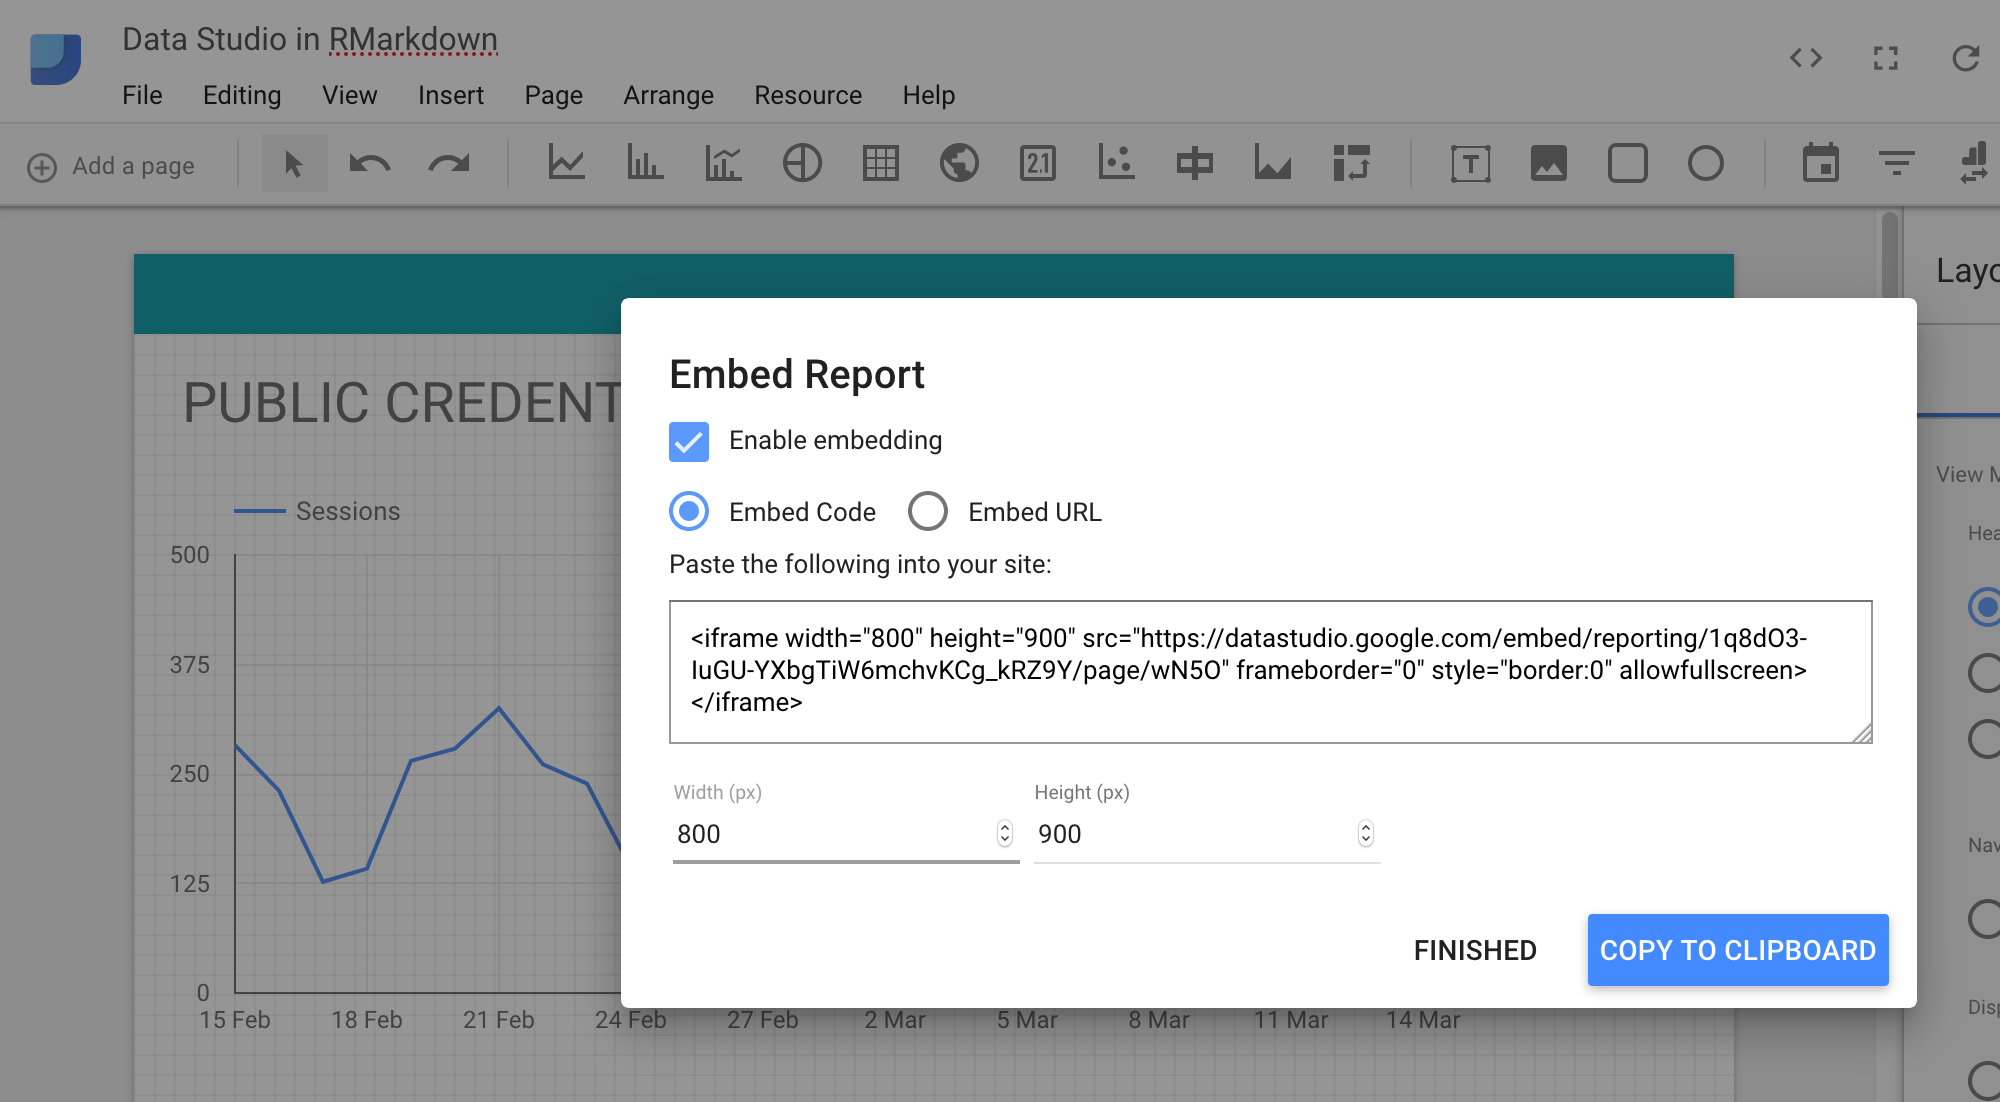
Then you can paste in that code straight in an .Rmd document, like I did with this blog (which runs on RMarkdown via Hugo):
<iframe width="600" height="500"
src="https://datastudio.google.com/embed/reporting/1q8dO3-IuGU-YXbgTiW6mchvKCg_kRZ9Y/page/wN5O"
frameborder="0"
style="border:0" allowfullscreen></iframe>
Above I put in backticks to demo the code I pasted in, but you don’t need to do that - below is result of the code pasted in as is into the .Rmd doc
Tweak the width and height so it fits your layout - I set the height and width of the Data Studio dashboard to the same as the iframe to avoid the scroll bars appearing.
For standalone .Rmd documents, 800 pixel width looks best, but this blog is narrower so I went for 600 pixel width.
Private Data Studio reports
The above report is shared publically on the web, but you can do the same with private Data Studio reports.
Follow the same procedure, but only share privately in your Sharing settings - only people who have private access to this report will see it, others will get the This Data Studio report is private message.
e.g. You see this:
…but I see this:
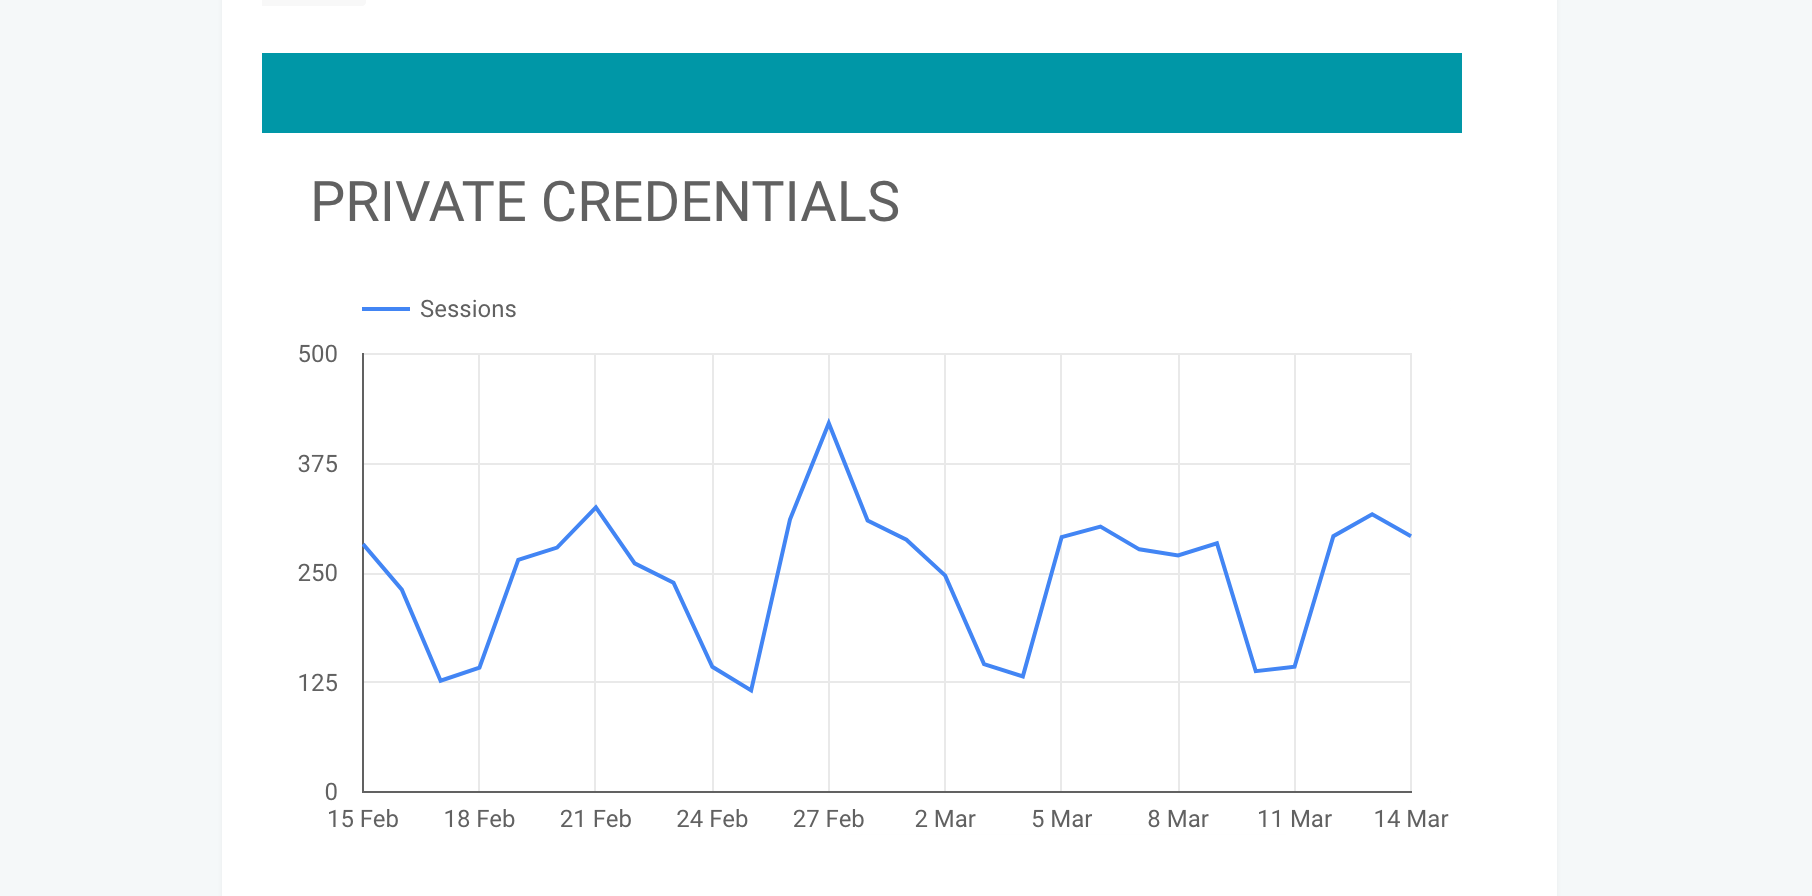
The authentication works in the same browser you are logged in with Google, since that is shared with a Google login cookie - e.g. if you are logged into Google Analytics in the same browser, you should see it. This means however you won’t see it work if viewing in the RStudio View panel.
Summary
If you are in the R world and maybe have not come across Google Data Studio, this may be helpful as another option for visualisation. Its main strengths are that it is free, is quick to get to visualisations, has powerful filter controls and lots of nice API connectors (including user made community connectors that connect to stuff like Facebook, Bing, LinkedIn etc.) although if you want to do more complex custom visuals you will find it not as fully tweakable as a paid for solution such as Tableau or Qlikview.
If you are in the Digital Marketing world you probably already know Data Studio, but perhaps knowing you have the ability to embed Data Studio into RMarkdown provides you with a quick way to combine existing reports with the more advanced data analysis and visuals that R can provide.
There is to my knowledge no way to connect the two (e.g. change a filter in Data Studio and it affects the R visuals) but that would be cool, if anyone figures out a way to do that let me know!